

Clinton vs. Sanders (Nigel Paray for CNN)
Actual Results:
As a result of his big New York loss, Sanders has taken a hit since my last update. He now trails Clinton by 243 pledged delegates. Clinton now holds a 54.6% to 45.4% advantage vs. Sanders in total pledged delegate %. Furthermore, Sanders now needs 58.7% of remaining pledged delegates to win (vs. 41.4% for Clinton). This means that if Sanders wins 58.7% of the remaining pledged delegates, he would win the battle for pledged delegates (and by extension, the popular vote).
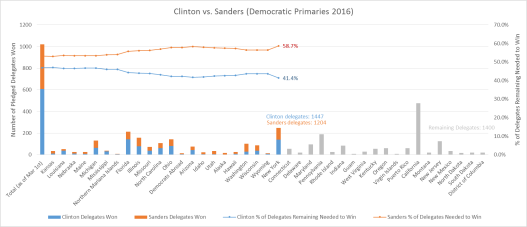
Fig 1. The graph shows (off the left-hand axis) the number of pledged delegates won by Clinton and Sanders by state and cumulatively (Clinton in blue and Sanders in red); the remaining pledged delegates in the race (in gray); and the % of those remaining delegates needed to win for each candidate (off the right-hand axis).
A few notes worth mentioning:
- There were some small changes in pledged delegates won in previous primaries that were retroactively adjusted as a result of final voting numbers coming in. Clinton lost 1 pledged delegate in Georgia, 2 in Arizona, but gained 1 in Hawaii, for a net loss of 2 delegates relative to our last update.
- Sanders won the Nevada County Convention on April 2. The 12 pledged delegates that were up for contention were won 7 vs. 5 for Sanders despite the fact that Clinton had presumably won those delegates 7 vs.5 during the Precinct caucuses. Apparently, Clinton’s delegates didn’t show up. The remaining 23 delegates were not in contention. As a result of that, Sanders gained 2 delegates (and Clinton lost 2). To be clear, nothing is officially “won” until the Nevada Democratic Convention on May 14-15. Until then, it’s important to remember that all pledged delegate calculations are estimates only.
- Although Sanders won the popular vote in Wyoming 56% to 44%, both he and Clinton ended up with 7 pledged delegates apiece. This is due to rounding. Recall that delegates are allocated proportionally on a district by district level according to their popular vote in those districts (in addition to the PLEOs and delegates at large for the state). Sometimes, a candidate can be unlucky, in the sense that rounding on a district by district level doesn’t end up reflecting overall popular vote numbers (keep in mind that this has happened to Clinton before as well).
Analysis of Actuals vs. Projections:
The model did really well in its projections of Wisconsin, Wyoming and New York. Cumulatively, Clinton won 184 delegates vs. Sanders’ 163 delegates. The model predicted exactly those cumulative numbers for a delta of 0. Still, overall, the model had projected a lead of 413 pledged delegates for Clinton at this point, for a 57.8% vs. 42.2% Clinton lead, so the model is still clearly over-projecting in favor of Clinton (by +3.2%). That overshoot can be largely attributed to Sanders exceeding expectations during his caucus run over the past month. Final model projections are +584 pledged delegates and a 57.2% vs. 42.8% win for Clinton. As a result of the retroactive changes in delegates before March 1st (Georgia and Nevada), the projected delegate delta went down from 590 to 584. Projections were developed right after Super Tuesday on March 1st. See here.
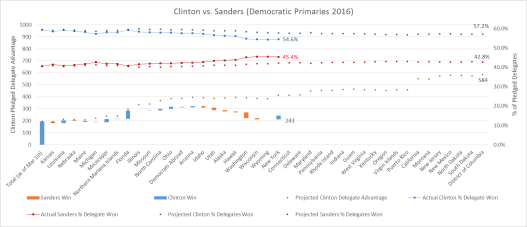
Fig 2. The graph shows (off the left-hand axis) the delegates won or lost by Clinton after each primary (blue bars mean Clinton won the state; red means Sanders won); the size of the bars reflect the difference in delegates won or lost for each state. The bars are staggered in “water-fall” fashion to reflect Clinton’s actual total delegate lead, which is compared against model projections of Clinton’s delegate lead (black dots). The graph also tracks (off the right-hand axis) actual delegate % won for Clinton (blue line) vs. Sanders (red line), and compares against model projected % for Clinton (blue dots) vs. Sanders (red dots)

Table 1. The table tracks actual pledged delegates won by Clinton and Sanders vs. model projected delegates, and calculates the delta between the two
Analysis Going Forward:
The expectation is for Sanders to continue losing ground in the next 5 states that vote on the 26th of April. I expect Connecticut and Rhode Island to be close, and Maryland and Delaware to be big victories for Clinton. Pennsylvania is an interesting one, in the sense that I expect it to be closer than what most polls are predicting, but I still expect Clinton to win it. All 5 states are primaries, and with the exception of Rhode Island, all of them are closed primaries (Rhode Island is semi-closed). As such, I expect Clinton to slightly outperform her demographic projections. Next update after the 26th of April round of primaries.
How the model “works”:
The model regressed delegates won by Clinton vs. Sanders for primaries on March 1st and before against the “racial makeup” of those states. The resulting regression coefficients are then used to project future primaries based on the “racial makeup” of those future states.
