
Clinton vs. Sanders (Nigel Paray for CNN)
For fun, I plan on updating the Clinton vs. Sanders nomination battle after each major set of primaries and tracking actual pledged delegate counts vs. projected delegate counts based on the model I developed right after Super Tuesday (March 1st). See previous post here.
Projections were developed right after March 1st and will not be changed but I will update the actual count to compare against model projections.
Right after Super Tuesday, Clinton led Sanders by 199 delegates and had won 59.7% of the pledged delegates (vs. 40.3% for Sanders). Since then, Clinton has widened her lead to 223 pledged delegates and leads Sanders 58.4% vs. 41.6% in total pledged delegate %. The model projected a lead of 249 delegates for Clinton at this point, for a 59.4% vs. 40.6% Clinton lead, so the model is slightly over-projecting in favor of Clinton. Final model projections are +590 delegates and a 57.3% vs. 42.7% win for Clinton. See table and graph below:
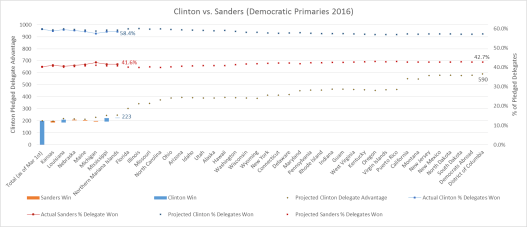
Fig 1. The graph shows (off the left-hand axis) the delegates won or lost by Clinton after each primary (blue bars mean Clinton won the state; red means Sanders won); the size of the bars reflect the difference in delegates won or lost for each state. The bars are staggered in “water-fall” fashion to reflect Clinton’s actual total delegate lead, which is compared against model projections of Clinton’s delegate lead (black dots). The graph also tracks (off the right-hand axis) actual delegate % won for Clinton (blue line) vs. Sanders (red line), and compares against model projected % for Clinton (blue dots) vs. Sanders (red dots)

Table 1. The table tracks actual pledged delegates won by Clinton and Sanders vs. model projected delegates, and calculates the delta between the two
How the model “works”:
The model regressed delegates won by Clinton vs. Sanders for primaries on March 1st and before against the “racial makeup” of those states. The resulting regression coefficients were then used to project future primaries based on the “racial makeup” of those future states.
