• Blog
  • Welcome

Notes From Underground

~ by Nicolas Sawaya

Notes From Underground

Category Archives: American Politics

Trump’s Immigrant / Refugee / Muslim Ban

20 Monday Feb 2017

Posted by Nicolas Sawaya in American Current Events, American Politics, Law

≈ Leave a comment

Tags

Trump; Executive Order; Muslim Ban; Immigration

trump

President Donald Trump

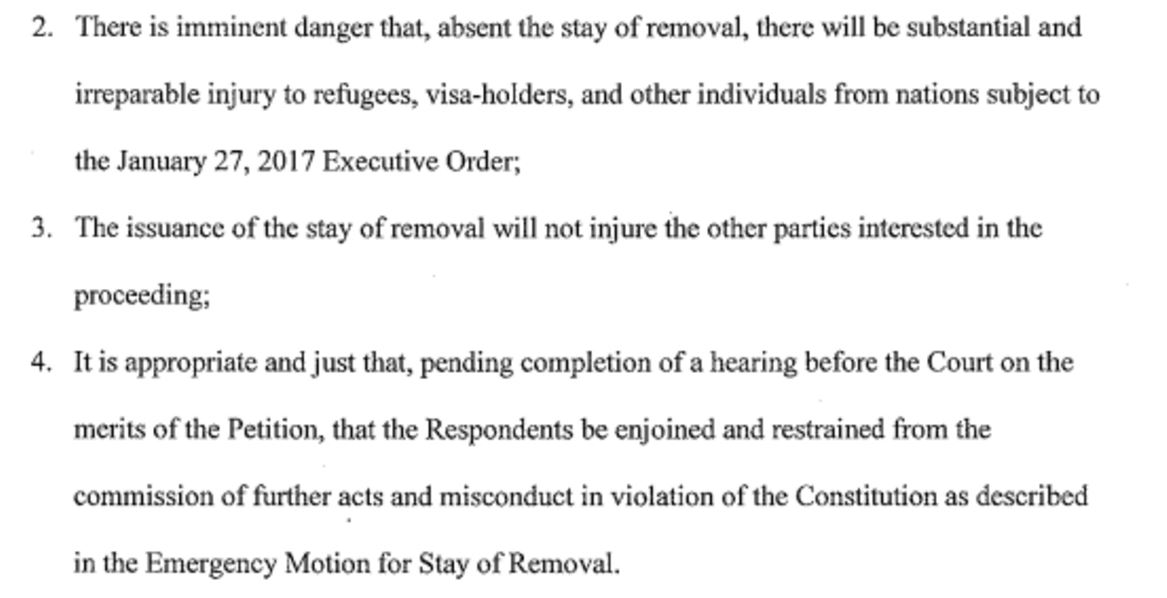
On the 27th of January 2017, Donald Trump signed an executive order (EO) titled “Protecting the Nation from Foreign Terrorist Entry into the United States”. The EO contains multiple controversial sections, including a 90-day ban on foreign nationals from seven-Muslim majority countries (with some exceptions), a 120-day ban on all refugees, an indefinite ban on all Syrian refugees, and a prioritization of refugee applicants whose religion is a minority religion in their country of nationality.

As of January 30th, according to numbers compiled by Customs and Border Protection (CBP) and as reported by the Daily Beast, the passing of this EO had caused 200-250 travelers at US airports to be denied entry after having flown to the United States on valid visas or green cards; as of February 2nd, according to CBP, 1222 travelers were denied from boarding flights for the United States (87 visa-holders were granted waivers); and as of February 3rd, according to a lawyer in the Justice Department, more than 100,000 visas had been revoked, although the State Department disputed that number and said that “only” 60,000 visas had been revoked.

The EO has engendered a swell of opposition to what has variously been described as an immigration ban, a refugee ban and a Muslim ban, including tens of thousands of people in multiple US cities who protested the ban, as well as the filing of dozens of lawsuits challenging the executive order on various grounds. As of February 3rd, a Seattle-based federal judge imposed a temporary restraining order on the EO, effectively suspending it, and on February 9th, the 9th Circuit Court of Appeals denied an emergency motion for a stay of the TRO filed by the Trump administration (essentially upholding the TRO). Given the level of opposition to the EO and the current legal battles being fought in courts across the US, the purpose of this article is to examine the order in detail, analyze some of its more controversial aspects and provide an up-to-date view of the latest legal developments.

1) Purpose of Executive Order

The ostensible purpose of this executive order is stated in Section 1 [italics mine]:

“The visa-issuance process plays a crucial role in detecting individuals with terrorist ties and stopping them from entering the United States.  Perhaps in no instance was that more apparent than the terrorist attacks of September 11, 2001, when State Department policy prevented consular officers from properly scrutinizing the visa applications of several of the 19 foreign nationals who went on to murder nearly 3,000 Americans.  And while the visa-issuance process was reviewed and amended after the September 11 attacks to better detect would-be terrorists from receiving visas, these measures did not stop attacks by foreign nationals who were admitted to the United States.

Numerous foreign-born individuals have been convicted or implicated in terrorism-related crimes since September 11, 2001, including foreign nationals who entered the United States after receiving visitor, student, or employment visas, or who entered through the United States refugee resettlement program. Deteriorating conditions in certain countries due to war, strife, disaster, and civil unrest increase the likelihood that terrorists will use any means possible to enter the United States.  The United States must be vigilant during the visa-issuance process to ensure that those approved for admission do not intend to harm Americans and that they have no ties to terrorism.

In order to protect Americans, the United States must ensure that those admitted to this country do not bear hostile attitudes toward it and its founding principles.  The United States cannot, and should not, admit those who do not support the Constitution, or those who would place violent ideologies over American law.  In addition, the United States should not admit those who engage in acts of bigotry or hatred (including “honor” killings, other forms of violence against women, or the persecution of those who practice religions different from their own) or those who would oppress Americans of any race, gender, or sexual orientation”.

In reading this section, one is left with the impression that the existing visa-issuance process is in shambles and that the United States has been invaded by foreign-born terrorists. However, when we look at the statistics for terrorism-related deaths in the US by foreign-born terrorists over the past 40 years, a diametrically opposed picture emerges. According to the CATO institute (a libertarian-leaning think tank), between 1975 and 2015, 3024 people have been killed by foreign-born terrorists.

chance-of-dying-by-a-foreign-based-terrorist-cato

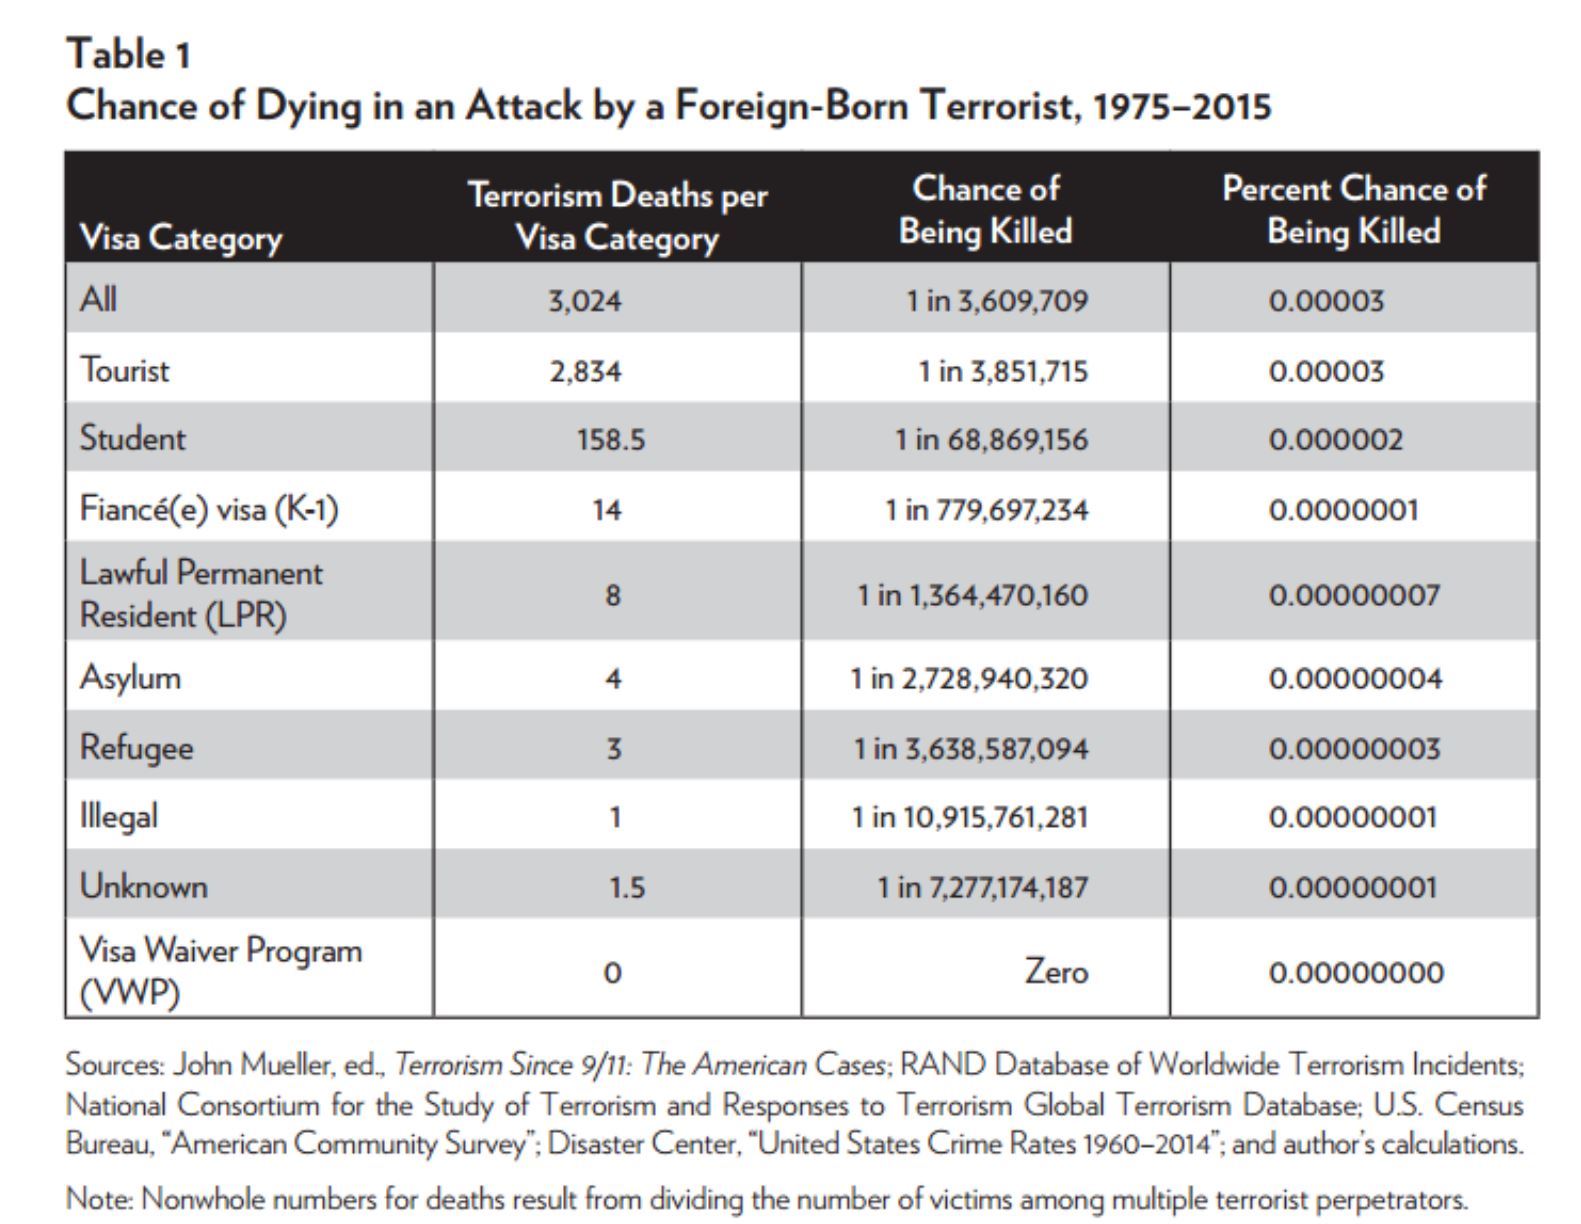
These statistics include 9/11, which is responsible for the vast majority of those deaths (2983 people were killed, excluding the 19 hijackers), and which indeed was committed by foreign-born terrorists on temporary visas (18 of the 19 9/11 hijackers entered on tourists visas; 1 was on a student visa). If we split this period between pre-9/11 and post-9/11 eras, then according to CATO:

“The period from 1975 to 2001 had only 17 murders committed by 16 foreign-born terrorists of a total of 64 who either tried or were successful in their attacks. During the same time period, 305 people were killed in terrorist attacks committed by native-born Americans and those with unknown nationalities […] From September 12, 2001, until December 31, 2015, 24 people were murdered on U.S. soil by a total of 5 foreign-born terrorists, while 65 other foreign-born terrorists attempted or committed attacks that did not result in fatalities. During the same period, 80 people were murdered in terrorist attacks committed by native-born Americans and those with unknown nationalities”.

It becomes clear then, that with the exception of 9/11, the number of deaths resulting from foreign-born terrorists is both low overall, and lower than terrorist attacks committed by American-born terrorists (both in the pre and post-9/11 eras). In fact, if we exclude 9/11 as a unique outlier, the annual chance of being killed by a foreign-born terrorist in the US is 1 in 250 million per year over the period 1975-2015 (those are about the odds of winning the Powerball lottery). In the period before 9/11, the odds are 1 in about 350 million per year, while the odds are 1 in 175 million in the period post-9/11 per year. Either way, these odds are extremely low. Even if we include 9/11 in the statistics, the odds of being killed by a foreign-born terrorist are 1 in 3.6 million per year (for those of you interested in the math, take the total number of deaths over the particular period of interest, for example 3024 deaths from 1975-2015, and divide that by the number of years in that period (40), and then again by the average number of people in the US over that period (around ~275 million)).

To put things in perspective, let’s take a look at lightning-strike data in the US:

“According to the NWS [National Weather Service] Storm Data, over the last 30 years (1986-2015) the U.S. has averaged 48 reported lightning fatalities per year. Only about 10% of people who are struck by lightning are killed, leaving 90% with various degrees of disability.”

This implies that about 480 people per year in the US were struck by lightning (10% of whom died) over the period 1986-2015 (this is likely an underestimate given that these are based on reported numbers). Assuming similar numbers between 1975 and 1985, about 19,000 people from 1975 to 2015 would have been struck by lightning. Comparing these numbers to deaths by foreign-born terrorists, Americans are about 6 times more likely (when including 9/11) and 450 times more likely (when excluding 9/11) to be struck by lightning than to die at the hands of a foreign-born terrorist.

To continue putting things in perspective, according to CATO, 768,000 people (including the 3024 killed by foreign-born terrorists) were murdered in the US between 1975 and 2015.

us-murder-rate-cato

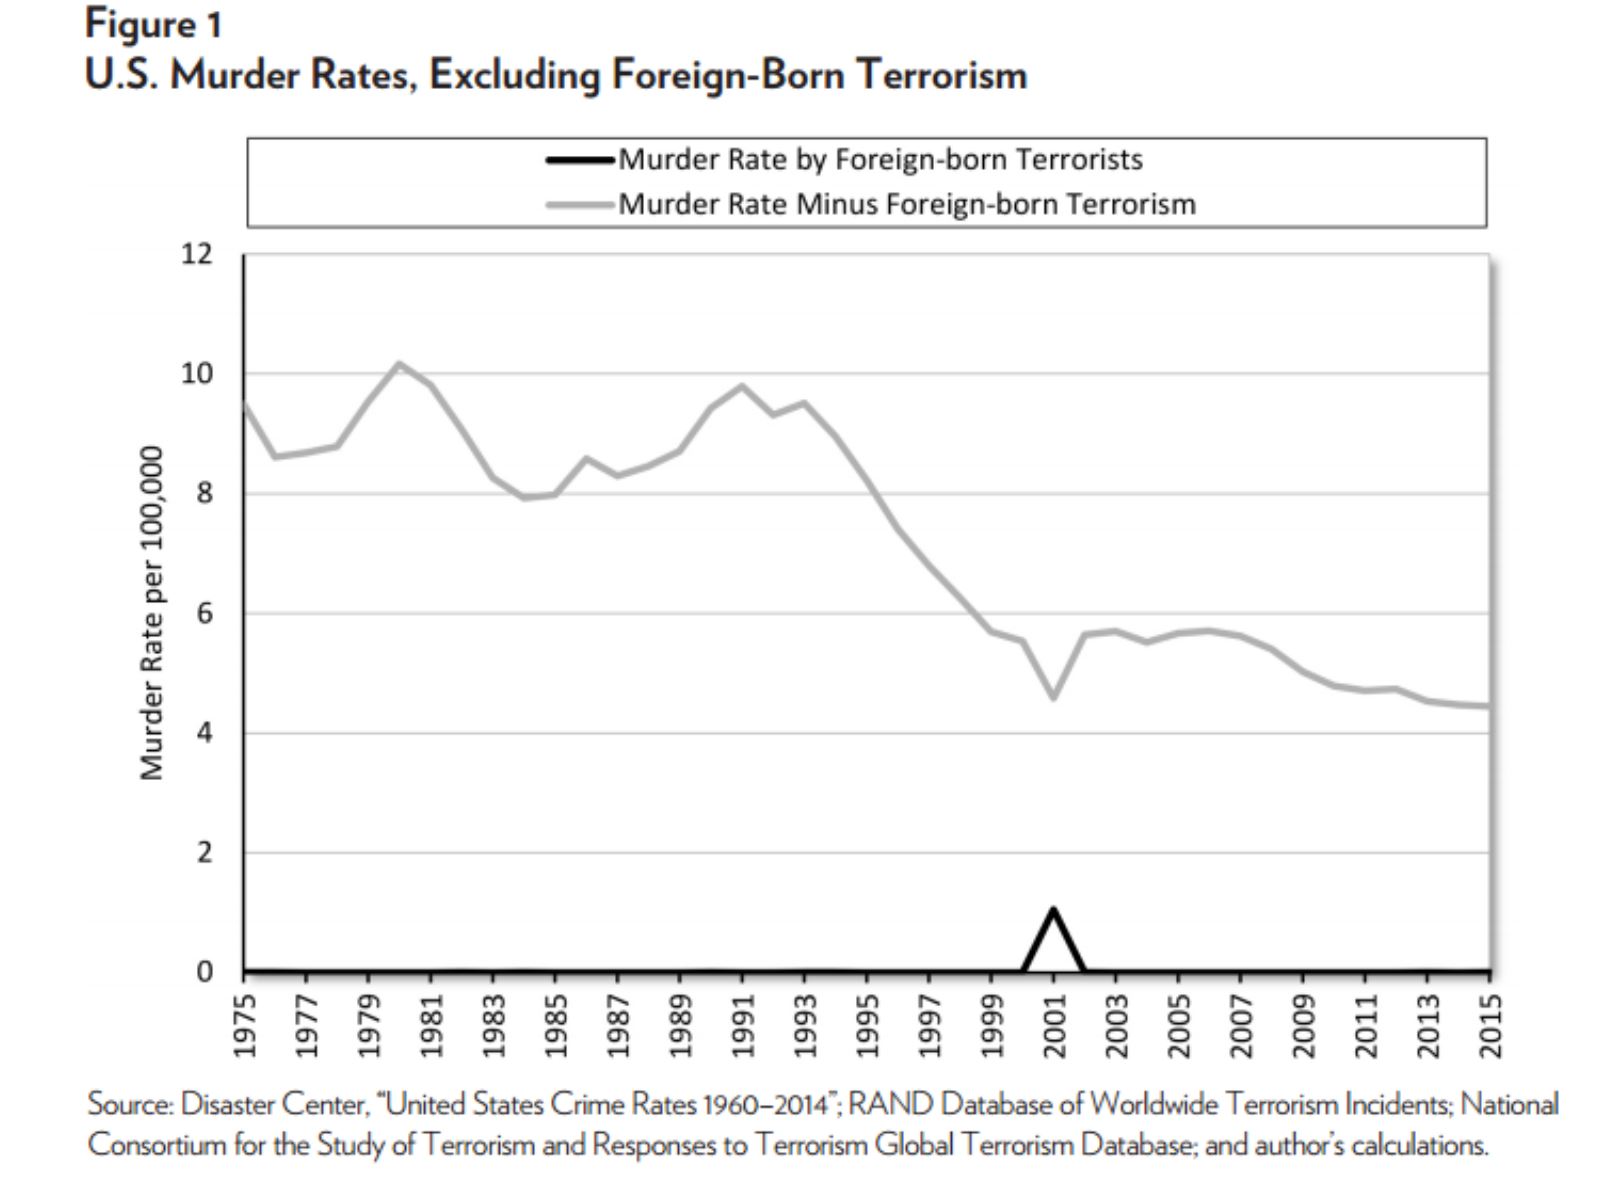
Comparing these numbers to deaths by foreign-born terrorists, Americans are more than 250 times more likely (when including 9/11) and about 15,000 times more likely (when excluding 9/11) to be murdered in the US than to die at the hands of a foreign-born terrorist.

Finally, for people worried about refugees (the topic of Section 5 of the executive order), according to CATO:

“Of the 3,252,493 refugees admitted from 1975 to the end of 2015, 20 were terrorists, which amounted to 0.00062 percent of the total. In other words, one terrorist entered as a refugee for every 162,625 refugees who were not terrorists. Refugees were not very successful at killing Americans in terrorist attacks. Of the 20, only three were successful in their attacks, killing a total of three people and imposing a total human cost of $45 million, or $13.84 per refugee visa issued. The three refugee terrorists were Cubans who committed their attacks in the 1970s and were admitted before the Refugee Act of 1980”.

Crunching the numbers, the odds of someone in the US being killed in a terrorist attack by a refugee are 1 in 3.6 billion per year over the period 1975 to 2015. Since the Refugee Act of 1980 was passed, not a single death in the US was the result of a terrorist attack by a refugee. In other words, the odds of someone in the US dying from a terrorist attack committed by a refugee since 1980 is literally 0.

2) The Travel Ban on Seven-Muslim Majority Countries

Section 3 of the executive order, titled “Suspension of Issuance of Visas and Other Immigration Benefits to Nationals of Countries of Particular Concern”, states [italics mine]:

“(a)  The Secretary of Homeland Security, in consultation with the Secretary of State and the Director of National Intelligence, shall immediately conduct a review to determine the information needed from any country to adjudicate any visa, admission, or other benefit under the INA (adjudications) in order to determine that the individual seeking the benefit is who the individual claims to be and is not a security or public-safety threat.

 (b)  The Secretary of Homeland Security, in consultation with the Secretary of State and the Director of National Intelligence, shall submit to the President a report on the results of the review described in subsection (a) of this section, including the Secretary of Homeland Security’s determination of the information needed for adjudications and a list of countries that do not provide adequate information, within 30 days of the date of this order.  The Secretary of Homeland Security shall provide a copy of the report to the Secretary of State and the Director of National Intelligence.

(c)  To temporarily reduce investigative burdens on relevant agencies during the review period described in subsection (a) of this section, to ensure the proper review and maximum utilization of available resources for the screening of foreign nationals, and to ensure that adequate standards are established to prevent infiltration by foreign terrorists or criminals, pursuant to section 212(f) of the INA, 8 U.S.C. 1182(f), I hereby proclaim that the immigrant and nonimmigrant entry into the United States of aliens from countries referred to in section 217(a)(12) of the INA, 8 U.S.C. 1187(a)(12), would be detrimental to the interests of the United States, and I hereby suspend entry into the United States, as immigrants and nonimmigrants, of such persons for 90 days from the date of this order (excluding those foreign nationals traveling on diplomatic visas, North Atlantic Treaty Organization visas, C-2 visas for travel to the United Nations, and G-1, G-2, G-3, and G-4 visas).

(d)  Immediately upon receipt of the report described in subsection (b) of this section regarding the information needed for adjudications, the Secretary of State shall request all foreign governments that do not supply such information to start providing such information regarding their nationals within 60 days of notification.

(e)  After the 60-day period described in subsection (d) of this section expires, the Secretary of Homeland Security, in consultation with the Secretary of State, shall submit to the President a list of countries recommended for inclusion on a Presidential proclamation that would prohibit the entry of foreign nationals (excluding those foreign nationals traveling on diplomatic visas, North Atlantic Treaty Organization visas, C-2 visas for travel to the United Nations, and G-1, G-2, G-3, and G-4 visas) from countries that do not provide the information requested pursuant to subsection (d) of this section until compliance occurs.

(f)  At any point after submitting the list described in subsection (e) of this section, the Secretary of State or the Secretary of Homeland Security may submit to the President the names of any additional countries recommended for similar treatment.

(g)  Notwithstanding a suspension pursuant to subsection (c) of this section or pursuant to a Presidential proclamation described in subsection (e) of this section, the Secretaries of State and Homeland Security may, on a case-by-case basis, and when in the national interest, issue visas or other immigration benefits to nationals of countries for which visas and benefits are otherwise blocked.

(h)  The Secretaries of State and Homeland Security shall submit to the President a joint report on the progress in implementing this order within 30 days of the date of this order, a second report within 60 days of the date of this order, a third report within 90 days of the date of this order, and a fourth report within 120 days of the date of this order”.

I’ve highlighted sub-section 3(c) in italics since I intend to focus on this section. The purpose of this section is to impose a temporary 90-day ban into the US on all foreign nationals from seven Muslim-majority countries: Iran, Iraq, Syria, Sudan, Somalia, Yemen and Libya. Although these countries are not explicitly named in this section, they are implied by reference to the appropriate sections of the Immigration and Nationality Act (INA) in the executive order. To be clear, Section 217 (a)(12) of the Immigration and Nationality Act (INA), also referred to by its US code 8 U.S.C. 1187(a)(12), is a new section in the INA that was recently added after the “Visa Waiver Program Improvement and Terrorist Travel Prevention Act of 2015” became law as part of the year-end spending bill President Obama signed on December 18, 2015. The purpose of this Act was to restrict the use of the visa-waiver program for certain nationals who traveled to Syria, Iran, Iraq and Sudan, although the list was expanded in February of 2016 to also include Libya, Yemen and Somalia. The visa waiver program “allows citizens of 38 (mostly European) countries to travel to the United States without first obtaining a visa“. The purpose of this Act, then, was to change the process by which citizens from these 38 countries, having traveled to any of the listed seven countries, obtained visas into the country (these citizens had to go through an interview process to now obtain visas into the US if they had traveled to the listed seven countries, whereas they didn’t need visas before the passing of the Act). As such, although it is true that the Obama administration had identified these seven countries as “countries of concern”, the Act of 2015 did not ban foreign nationals from these countries from entering into the US; only Trump’s executive order does that.

At any rate, before delving into the details of section 3(c) of the EO, it is important to first define the terms in this section. The term immigrant, according to its legal definition, refers to people who intend to permanently immigrate to the US; i.e. those who have green cards or lawful permanent residence. In contrast, non-immigrants are those who do not intend to stay in the US on a permanent basis, and include people such as students (on F1-visas for example), guest workers (on OPT or H1-B visas), tourists etc.

According to David Bier of the CATO institute, Trump’s ban targeting immigrants on the basis of their country of origin is illegal. Indeed, according to Bier, Section 202(a)(1)(A) of the INA states that except in cases specified by Congress in section 101(a)(27):

“[…] no person shall receive any preference or priority or be discriminated against in the issuance of an immigrant visa because of the person’s race, sex, nationality, place of birth, or place of residence”

This section of the INA does not cover the category of non-immigrants, but it does directly relate to immigrants (i.e. Green Card holders or permanent lawful residents). Despite that, acting Department of Homeland Security (DHS) spokeswoman Gillian Christensen said, on January 28 2017, that the executive order “will bar green card holders”, before a “senior administration official clarified […] that green card holders from the seven countries affected in the order who are currently outside the U.S. will need a case-by-case waiver to return to the U.S. […] Green card holders in the U.S. will have to meet with a consular officer before departing the country, the official said”.

This had the potential of impacting up to 500,000 lawful US residents from the seven countries listed above, before Donald F. McGahn II – Counsel to President Trump – “re-interpreted” this part of the executive order and issued a memo on February 1st 2017 exempting lawful permanent residents from the ban, which pundits called “highly unusual” and interpreted as a “face-saving way for the White House to redraft the executive order without incurring the embarrassment of actually having Trump sign a new executive order”. It is important to note, however, that despite this “re-interpretation”, the 9th Circuit Court of Appeals, within the context of the Trump administration’s challenge to the temporary restraining order issued on February 3rd (see section 4 below for details), has stated in their legal opinion (on p. 20-21) that the White House counsel is not empowered to issue an amendment superseding the EO; as such, it is not clear that this “re-interpretation” is legally binding:

“At this point, however, we cannot rely upon the Government’s contention that the Executive Order no longer applies to lawful permanent residents. The Government has offered no authority establishing that the White House counsel is empowered to issue an amended order superseding the Executive Order signed by the President and now challenged by the States, and that proposition seems unlikely. Nor has the Government established that the White House counsel’s interpretation of the Executive Order is binding on all executive branch officials responsible for enforcing the Executive Order. The White House counsel is not the President, and he is not known to be in the chain of command for any of the Executive Departments. Moreover, in light of the Government’s shifting interpretations of the Executive Order, we cannot say that the current interpretation by White House counsel, even if authoritative and binding, will persist past the immediate stage of these proceedings”.

With regards to non-immigrants, the INA doesn’t provide the same protections as it does to immigrants. However, this does not mean that non-immigrants have no rights under the US constitution. Indeed, the 9th Circuit Court of Appeals has emphasized that:

“The procedural protections provided by the Fifth Amendment’s Due Process Clause are not limited to citizens. Rather, they “appl[y] to all ‘persons’ within the United States, including aliens,” regardless of “whether their presence here is lawful, unlawful, temporary, or permanent.” Zadvydas v. Davis, 533 U.S. 678, 693 (2001). These rights also apply to certain aliens attempting to reenter the United States after travelling abroad. Landon v. Plasencia, 459 U.S.21, 33-34 (1982)”.

3) The Refugee Ban

Section 5 of the executive order, titled “Realignment of the U.S. Refugee Admissions Program for Fiscal Year 2017” states [italics mine]:

“(a)  The Secretary of State shall suspend the U.S. Refugee Admissions Program (USRAP) for 120 days.  During the 120-day period, the Secretary of State, in conjunction with the Secretary of Homeland Security and in consultation with the Director of National Intelligence, shall review the USRAP application and adjudication process to determine what additional procedures should be taken to ensure that those approved for refugee admission do not pose a threat to the security and welfare of the United States, and shall implement such additional procedures.  Refugee applicants who are already in the USRAP process may be admitted upon the initiation and completion of these revised procedures.  Upon the date that is 120 days after the date of this order, the Secretary of State shall resume USRAP admissions only for nationals of countries for which the Secretary of State, the Secretary of Homeland Security, and the Director of National Intelligence have jointly determined that such additional procedures are adequate to ensure the security and welfare of the United States.

(b)  Upon the resumption of USRAP admissions, the Secretary of State, in consultation with the Secretary of Homeland Security, is further directed to make changes, to the extent permitted by law, to prioritize refugee claims made by individuals on the basis of religious-based persecution, provided that the religion of the individual is a minority religion in the individual’s country of nationality.  Where necessary and appropriate, the Secretaries of State and Homeland Security shall recommend legislation to the President that would assist with such prioritization.

(c)  Pursuant to section 212(f) of the INA, 8 U.S.C. 1182(f), I hereby proclaim that the entry of nationals of Syria as refugees is detrimental to the interests of the United States and thus suspend any such entry until such time as I have determined that sufficient changes have been made to the USRAP to ensure that admission of Syrian refugees is consistent with the national interest.

(d)  Pursuant to section 212(f) of the INA, 8 U.S.C. 1182(f), I hereby proclaim that the entry of more than 50,000 refugees in fiscal year 2017 would be detrimental to the interests of the United States, and thus suspend any such entry until such time as I determine that additional admissions would be in the national interest.

(e)  Notwithstanding the temporary suspension imposed pursuant to subsection (a) of this section, the Secretaries of State and Homeland Security may jointly determine to admit individuals to the United States as refugees on a case-by-case basis, in their discretion, but only so long as they determine that the admission of such individuals as refugees is in the national interest — including when the person is a religious minority in his country of nationality facing religious persecution, when admitting the person would enable the United States to conform its conduct to a preexisting international agreement, or when the person is already in transit and denying admission would cause undue hardship — and it would not pose a risk to the security or welfare of the United States.

(f)  The Secretary of State shall submit to the President an initial report on the progress of the directive in subsection (b) of this section regarding prioritization of claims made by individuals on the basis of religious-based persecution within 100 days of the date of this order and shall submit a second report within 200 days of the date of this order.

(g)  It is the policy of the executive branch that, to the extent permitted by law and as practicable, State and local jurisdictions be granted a role in the process of determining the placement or settlement in their jurisdictions of aliens eligible to be admitted to the United States as refugees.  To that end, the Secretary of Homeland Security shall examine existing law to determine the extent to which, consistent with applicable law, State and local jurisdictions may have greater involvement in the process of determining the placement or resettlement of refugees in their jurisdictions, and shall devise a proposal to lawfully promote such involvement”.

Interpretation and “justification” of section 5(b)

I want to focus on section 5(b), which essentially states that refugee applicants claiming religious persecution will be prioritized “provided that the religion of the individual is a minority religion in the individual’s country of nationality”. 

It is not clear how the ambiguous language of 5(b) is to be interpreted, specifically the words “minority religion” and “country of nationality”. Would section 5(b) apply, for example, to certain groups of Muslims who are being persecuted for their minority religious beliefs, such as Shia Muslims facing religious persecution in Sunni majority countries like Saudi Arabia and Sunni Muslims facing discrimination in Shia majority countries like Iran, or would the Trump administration argue that the Shia  and Sunni categories are not religions but sects within Islam (and therefore, that intra-religious sectarian persecution does not qualify under 5(b)). Would section 5(b) apply to the Muslim Rohingya facing persecution in Buddhist-majority Myanmar, or would the Trump administration echo the claims made by the Myanmar government that the Rohingya’s country of origin is not Myanmar and that they are illicit foreigners from Muslim-majority Bangladesh (the Rohingya “are not regarded as one of the country’s [Myanmar] 135 official ethnic groups and are denied citizenship under Myanmar’s 1982 Citizenship Law, which effectively renders them stateless“)?

Regardless of how the language in 5(b) is to be generally interpreted, it is clear that at least in the particular case of Syrian refugees, the language of 5(b) was intended to prioritize Christian over Muslim refugees. Indeed, in an interview with Christian Broadcast News, Trump essentially stated that Syrian Christian (as opposed to Muslim) refugees would be prioritized in the refugee settlement process, in response to the interviewer’s question within the context of his executive order. Some conservative pundits such as David French from the National Review have attempted to justify this stance on Syrian refugees (if we read between the lines) by remarking that there seems to be a disparity in the number of Syrian Christian vs. Muslim Syrian refugees admitted into the US (Trump himself alludes to that in his interview). According to French:

“The Obama administration has resettled 13,210 Syrian refugees into the United States since the beginning of 2016 — an increase of 675 percent over the same 10-month period in 2015. Of those, 13,100 (99.1 percent) are Muslims — 12,966 Sunnis, 24 Shi’a, and 110 other Muslims — and 77 (0.5 percent) are Christians. Another 24 (0.18 percent) are Yazidis”.

The numbers quoted above seem to be correct, according to the Refugee Processing Center. The question is why have so few Syrian Christian refugees been admitted into the US? Is it because of discrimination, or for some other reason? French is correct in pointing out that around 10% of Syria’s pre-war population is Christian (at least according to the CIA World Factbook, which would put the number of Syrian Christians at around 2.1 million;  according to the Pew Research Center, around 5.2% of Syria’s population is Christian, which translates to about 1.1 million), but that is not the right metric to use to adduce any alleged disparity in the number of Christian vs. Muslim Syrian refugees (and by extension, potential discrimination in the refugee process), as this does not reflect the number of registered Syrian Christian refugees.

Neither is it helpful to make the case for discrimination in the refugee process on the basis of the number of Christians who have fled Syria. The conservative news network CNSNews has claimed that “estimates of the number of Christians who have fled their country since 2011 vary, but the international Christian charity Barnabas Fund estimated some 600,000 earlier this year, the European Parliament said at least 700,000 had done so, and a Chaldean Catholic bishop from Aleppo last March put the figure at at least one million“. As tragic as these numbers are, they only reflect the number of Syrian Christians who have fled Syria, and not the number of registered Christian refugees (which is what is needed to make the case for religious disparity in numbers in the refugee process).

Indeed, the only correct metric to use to adduce disparity in Christian vs. Muslim Syrian refugees in the refugee process is to check the religious denomination of the registered Syrian refugees. According to Robert Farley of FactCheck.org:

“Chris Boian, a spokesman for the United Nations High Commissioner for Refugees, said “UNHCR staff simply does not discriminate.” Boian said decisions about how to prioritize refugees is based on the “basic human needs” of refugees, regardless of religion, nationality or race.

The reality, he said, is that far fewer Christian Syrians have applied for resettlement.

According to data supplied by the UNHCR, just 1.5 percent of the 1 million Syrian refugees in Lebanon are Christians; 0.2 percent of the 655,000 Syrian refugees in Jordan are Christians; 0.3 percent of the 228,000 Syrians refugees in Iraq are Christians; and 0.1 percent of the 115,000 Syrian refugees in Egypt are Christians. (In Turkey, where there are 2.7 million Syrian refugees, they do not record the religion of refugees.)

“We don’t fully know why there are fewer Christians requesting refugee status with UNHCR,” Boian said”.

So, regardless of how many Syrian Christians may have fled Syria, it seems that disproportionately few have registered as refugees with UNHCR (the United Nations High Commissioner for Refugees is the UN refugee agency). Given that the US refugee settlement program relies on UNHCR for refugee applications (indeed, UNHCR “identifies those refugees who are most in need of resettlement to a third country — typically more developed countries, further from conflict regions, such as the United States”), it seems that the reason that so few Syrian Christians have been admitted as refugees into the US is because so few have registered with UNHCR (and the admitted numbers into the US seem consistent with their registered numbers with UNHCR). The real question then (as Boian has pointed out), is why so few Syrian Christians have requested refugee status with UNHCR. This is an important question to investigate, and Farley’s article offers a few hypotheses, although there does not seem to be an obvious answer to this question as of now. Regardless, the right course of action is to investigate this issue in more detail, and not to address it through the unconstitutional language of section 5(b) – see below.

The legality of section 5(b)

Many pundits, such as Mark Joseph Stern of Slate and David Cole of Just Security, have remarked that this section is meant to prioritize Christian (and other non-Muslim) applicants claiming refugee status over Muslim applicants, and as such, is unconstitutional since it violates the Establishment Clause (in the First amendment of the US Constitution). Both Stern and Cole remark that:

“According to the Supreme Court, “the clearest command of the Establishment Clause is that one religious denomination cannot be officially preferred over another.” Larson v. Valente, 456 US. 228, 244 (1982)”.

Furthermore, Cole argues that “one of the critical questions with respect to the validity of executive action challenged under the Establishment Clause is its intent and effect; if intended to disfavor a particular religion, it violates the Establishment Clause”. In an earlier article, he provides several lines of evidence that demonstrate Trump’s anti-Muslim bias:

  • On December 7, 2015, the Trump campaign issued a press release stating that “Donald J. Trump is calling for a total and complete shutdown of Muslims entering the United States until our country’s representatives can figure out what is going on.”
  • In July 2016, he effectively admitted that his revamping of the proposal was designed to target Muslims without expressly saying so. In an interview on “Meet the Press: with NBC’s Chuck Todd,” Trump said he would target immigrants from certain countries, but resisted the suggestion that this was a retreat from his proposal to target Muslims. “I actually don’t think it’s a rollback. In fact, you could say it’s an expansion… People were so upset when I used the word Muslim. Oh, you can’t use the word Muslim. Remember this. And I’m OK with that, because I’m talking territory instead of Muslim.”
  • In November 2015, Trump told NBC News he “would certainly implement” a database to track Muslims in the United States … “I would certainly implement that. Absolutely.” Would Muslims be legally required to register? “They have to be — they have to be,” Trump replied.
  • In March 2016, Trump said, “Frankly, look, we’re having problems with the Muslims, and we’re having problems with Muslims coming into the country.”

When this evidence is added to Trump’s previously discussed statement in the Christian Broadcast News interview, it seems quite clear that there is intent to favor one religion over another.

Finally, Cole makes the important point that even if Trump had not made his unconstitutional claim on TV (and therefore not revealed blatant intent), the distinction between majority and minority religion independently violates the principle of denominational neutrality:

“Moreover, even absent that evidence of Trump’s invidious intent, the order on its face favors refugees from “minority religions” over those from “majority religions” in any given country. That distinction independently violates the principle of denominational neutrality, even if in some countries it means we will be privileging Christians and in other countries Muslims.  The law struck down in Larson v. Valente did not name any particular denominations, but simply imposed differential registration and reporting requirements on religions that received more than half of their total contributions from members, and those that did not.  Even though the law did not single out a specific religion by name, it failed to treat all denominations the same, and therefore violated the Establishment Clause.  Thus, even if Donald Trump hadn’t admitted his unconstitutional purpose on TV, the executive order would be unconstitutional”.

4) Legal challenges to executive order

Since the passing of the executive order, various lawsuits have been filed challenging the legality of the order on various grounds. In this section, we examine the major legal challenges that have ensued since the passing of the order.

ACLU lawsuit results in temporary stay against EO

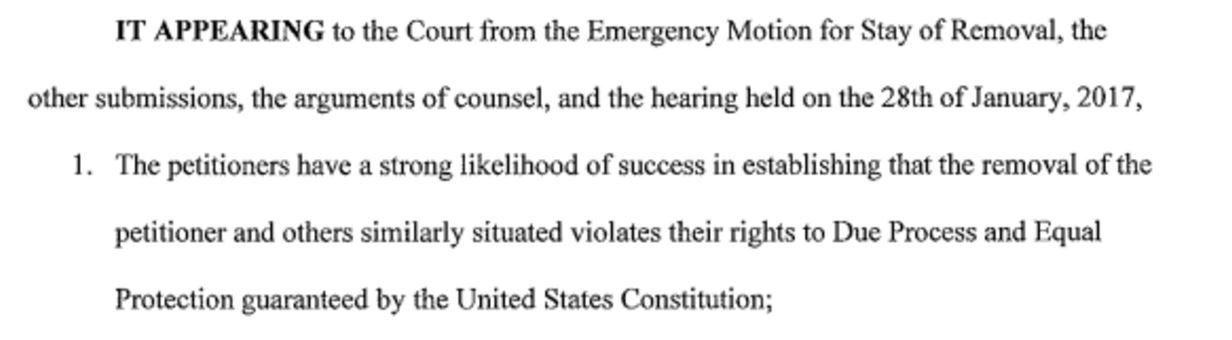
The first major legal challenge to the executive order was “brought by the American Civil Liberties Union on behalf of two men [Hameed Khalid Darweesh and Haider Sameer Abdulkhalek Alshawi] detained at John F. Kennedy International Airport in New York City”. Judge Ann M. Donnelly, a federal judge in Brooklyn, issued an emergency stay on January 28th 2017, temporarily allowing people who had landed in the United States with a valid visa to remain (although the suit was filed on behalf of the two men, the temporary stay applied nationally). Her justification for issuing the temporary stay was based on her assessment that the executive order violated the claimants’ rights to Due Process and Equal Protection under the US constitution (see below).

ann-donnelly-1

ann-donnelly-2

Mark Joseph Stern provides some useful background for the basis of this ruling:

“The Fifth Amendment to the Constitution provides basic procedural guarantees to individuals detained in the U.S., prohibiting the government from depriving individuals of liberty without “due process of law.” Alshawi arrived in the country lawfully carrying the requisite documentation. Pursuant to the Immigration and Nationality Act, he now has a right to apply for asylum and have his claims processed by federal authorities. But the government did not do that. Instead, it instantly placed him in detention, without a hearing or any kind of judicial oversight, and barred him from speaking with his attorneys.

That is an unconstitutional deprivation of Alshawi’s liberty without due process of law. The federal government cannot indefinitely detain a lawful visitor without a hearing or any semblance of reasonable suspicion because the president signed an executive order. Nor, under the equal protection component of the amendment’s Due Process Clause, may the government discriminate against Alshawi because of his national origin or religion”.

Washington and Minnesota lawsuit results in temporary restraining order against EO

The next major challenge against the executive order was brought forward by Washington State and Minnesota. After hearing both sides, Seattle-based federal Judge James Robart, a George Bush nominee who was confirmed by the Senate in a 99-0 vote, issued a temporary restraining order (TRO), “targeting and effectively neutralizing all of the order’s main tenets, including its prohibition of entry from seven Muslim-majority nations. The judge also specifically blocked any preference for religious minorities in those countries, which have been widely interpreted as singling out Christian refugees for preferential treatment“.

robart-2

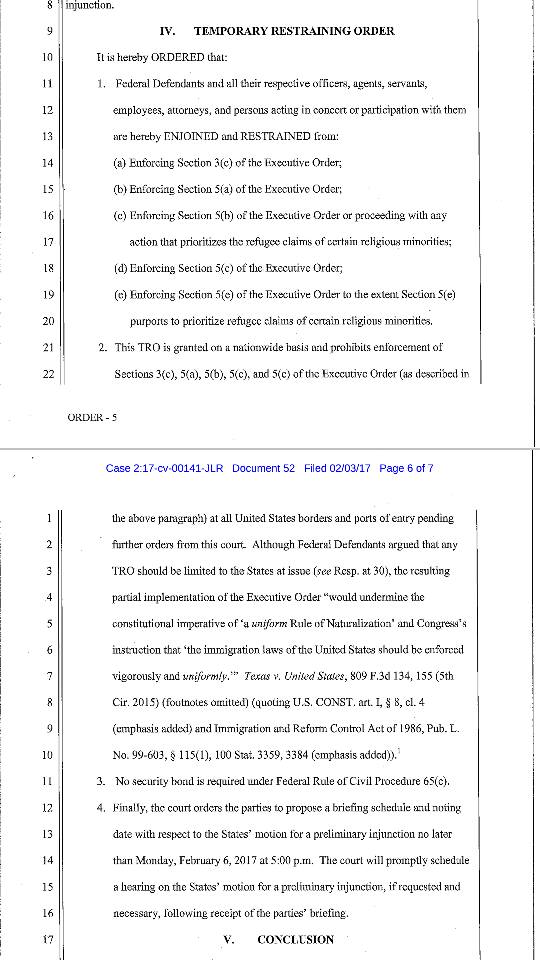
According to Judge Robart:

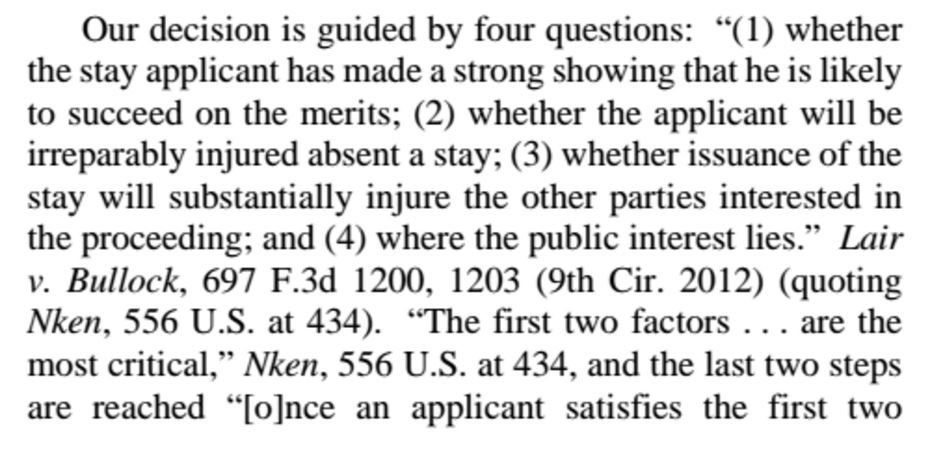
“The proper legal standard for preliminary injunctive relief requires a party to demonstrate (1) that he is likely to succeed on the merits, (2) that he is likely to suffer irreparable harm in the absence of preliminary relief, (3) that the balance of equities tips in his favor, and (4) that an injunction is in the public interest”.

Robart’s conclusion was that the States are:

“[…] likely to succeed on the merits of the claims that would entitle them to relief; the States are likely to suffer irreparable harm in the absence of preliminary relief; the balance of the equities favor the States; and a TRO is in the public interest”.

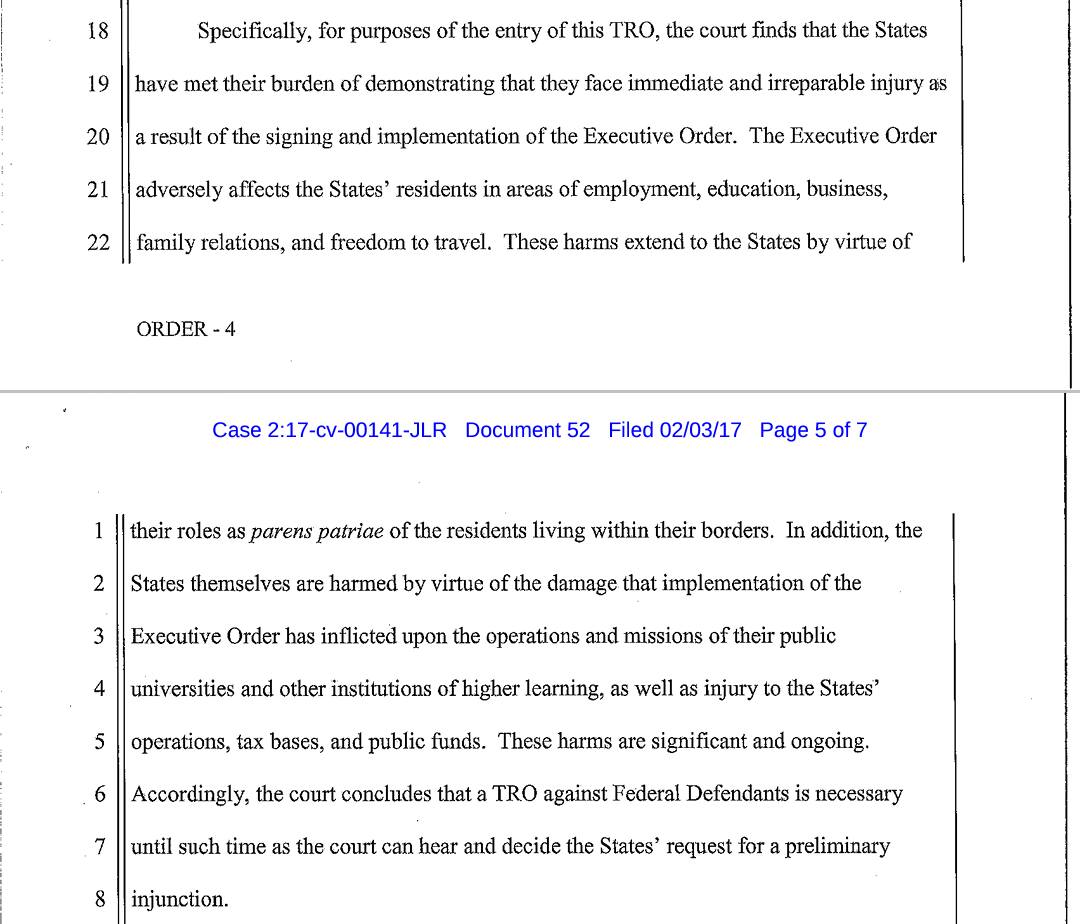
Although Robart does not discuss the details of item (1), he does explicitly discuss item (2) and claims that the “States have met their burden of demonstrating that they face immediate and irreparable injury as a result of the signing and implementation of the Executive Order”. The rationale behind this claim is summarized below:

1) Washington state and Minnesota residents were negatively impacted in areas of employment, education, business, family relations and freedom to travel.

2) Their harm extended to the States by virtue of the parens patriae legal doctrine (which is a “doctrine that grants the inherent power and authority of the state to protect persons who are legally unable to act on their own behalf”).

3) Direct harm to the States by virtue of the EO’s impact on the mission and operations of the States’ public universities as well as to the States’ tax base and public funds.

4) The TRO was extended beyond just Washington and Minnesota to the whole of the US by virtue of the view that immigration law should be applied uniformly (i.e. should be applied the same way everywhere in the US).

robart-1

Motion for an Emergency Stay of the TRO – denied by 9th Cicuit Court of Appeals

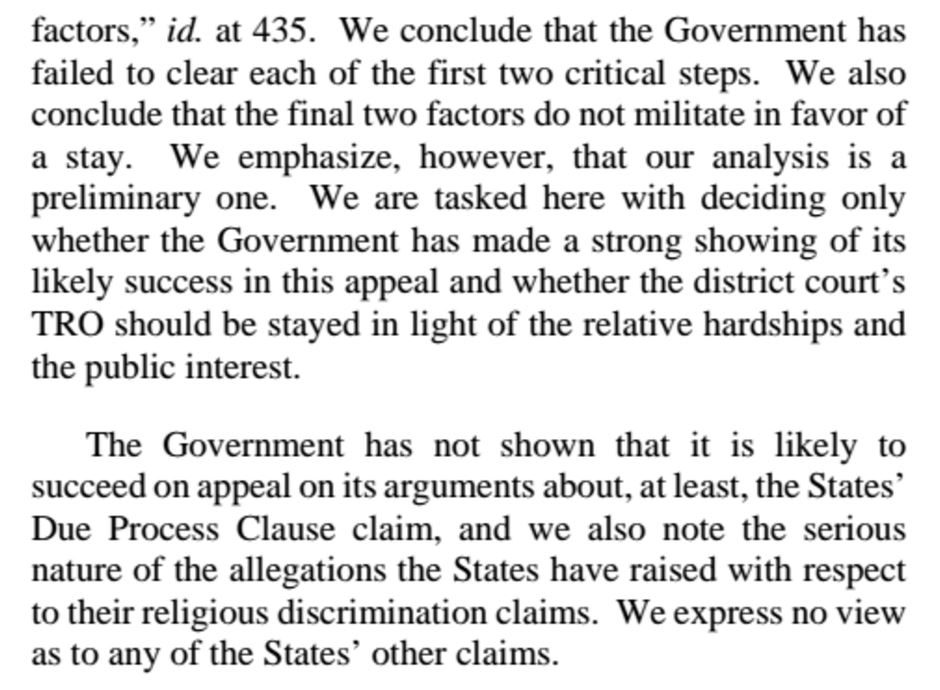
Unsurprisingly, the Trump administration filed a notice of appeal against Robart’s ruling on February 4th, and requested an emergency motion for a stay of Robart’s TRO in the 9th Circuit Court of Appeals; the Court subsequently denied this motion by a vote of 3-0 on February 9th. The main argument presented by the Court to deny the stay was based on their assessment that the Trump administration was unlikely to succeed in their appeal on the merits of their case, specifically around the States’ Due Process claim. According to the Court:

“In the district court, the States argued that the Executive Order violates the procedural due process rights of various aliens in at least three independent ways. First, section 3(c) denies re-entry to certain lawful permanent residents and non-immigrant visaholders without constitutionally sufficient notice and an opportunity to respond. Second, section 3(c) prohibits certain lawful permanent residents and non-immigrant visaholders from exercising their separate and independent constitutionally protected liberty interests in travelling abroad and thereafter re-entering the United States. Third, section 5 contravenes the procedures provided by federal statute for refugees seeking asylum and related relief in the United States”.

The Court essentially agreed that these due process claims had merit, and therefore that the Trump administration’s appeal was unlikely to be successful. The Court also expressed serious concern around the claims of religious discrimination in section 5(b), although “they reserved consideration of these claims until the merits of this appeal have been fully briefed”. A summary of the court’s rationale to deny the stay is presented below, but the complete ruling is worth reading in full.

circuit-court-of-appeals-1circuit-court-of-appeals-2

Clinton vs. Sanders Primaries: Final Tally

17 Sunday Jul 2016

Posted by Nicolas Sawaya in American Politics

≈ Leave a comment

Tags

Clinton; Sanders; Democratic Primaries

clinton-vs-sanders

Clinton vs. Sanders (Nigel Paray for CNN)

The purpose of this post is to present a final tally of the Clinton vs. Sanders primaries. As everyone already knows, Clinton beat Sanders rather handily, so this post is really for completeness. Having said that, I will also discuss the performance of the regression model I developed in more detail, present the mathematical formulation in case people are interested, as well as provide the code used to generate the regression results. I may write a follow-up post with detailed analysis and a breakdown of the numbers by state, by demographic category etc, but that will depend on how much time I have available.

Actual Results:

The final pledged delegate count is 2205 vs 1846 in favor of Clinton. As such, the final margin is 359 pledged delegates. Clinton won 54.4% of total pledged delegates vs 45.6% for Sanders. Note that Clinton won the popular vote by a larger margin than the pledged delegate vote given that Sanders won the a large number of pledged delegates in caucus states that had very low voter turnout.  Here’s the final tally:

Clinton vs Sanders Final Table

Table 1. The table tracks actual pledged delegates won by Clinton and Sanders vs. model projected delegates, and calculates the delta between the two

Analysis of Actuals vs. Projections:

Clinton vs Sanders Graph Final

Fig 1. The graph shows (off the left-hand axis) the delegates won or lost by Clinton after each primary (blue bars mean Clinton won the state; red means Sanders won); the size of the bars reflect the difference in delegates won or lost for each state. The bars are staggered in “water-fall” fashion to reflect Clinton’s actual total delegate lead, which is compared against model projections of Clinton’s delegate lead (black dots). The graph also tracks (off the right-hand axis) actual delegate % won for Clinton (blue line) vs. Sanders (red line), and compares against model projected % for Clinton (blue dots) vs. Sanders (red dots)

So how did the model do overall? Final tally gives Clinton 54.4% of pledged delegates, whereas the model projected 57.3% (Sanders won 45.6% of pledged delegates vs. model projections of 42.7%). So the model clearly was “biased” towards Clinton, but still, given that these projections were made over 4 months ago (and remained unchanged), coming in within less than 3% of actuals (2.9% to be exact) is pretty good!

A different cut of the data suggests a similarly predictive story. There were 41 contests after March 1st for which we made predictions. The model correctly predicted 33 out of the 41 contest winners; that’s an 80%+ success rate. The model misses were Michigan, Democrats Abroad, Alaska, Hawaii, Connecticut, Indiana, Kentucky and South Dakota. What accounts for these misses?

  • Bad demographic data: Recall that the model works off of the “racial” demographics of states, and buckets them into 3 broad categories (White, Black, Hispanic) and a catch all Other category; if the demographic data available is poor or doesn’t “fit” this bucketing (especially if the Other category for a state is large), the projections will be a crap-shoot. We did not have good demographic data (or the data bucketing was poor) for the Northern Marianas, Democrats Abroad, Alaska, Hawaii, Guam, Virgin Islands or Puerto Rico, and so it isn’t a surprise that the model missed 3 out of those 7 contests (in retrospect, I shouldn’t have even attempted a projection of these contests given that the regression coefficients for the Other bucket were very much dependent on the results of tiny American Somoa).
  • Very close results (that could have gone either way): The model predicted very narrow victories for Sanders in Connecticut, Kentucky and South Dakota, whereas actual results very narrowly favored Clinton. The delta between actual number of pledged delegates won by Clinton (or Sanders) versus those predicted by the model was 1 for each one of those states.
  • Legitimate misses: The model missed both Michigan and Indiana by relatively wide margins. One can say that demographics in these states were clearly not the only story.

One final note on factors beyond demographics. As the race progressed, it became clear that the format of the contest (primary vs. caucus; open vs. closed etc) played an important, though secondary role, in the race. Demographics were still primary in predicting the race, but it’s also likely that including the format of the contest could have made the predictions more accurate. Having said that, it’s rather remarkable that something as crude as the “racial make-up” of the Democratic electorate could have such predictive power.

How the model “works”:

In the embedded document below, I provide details of the regression model actually used, including the mathematical formulation as well the code used to generate the regression coefficients that are then used in the projections.

Clinton vs. Sanders Primaries: Update 5-17

19 Thursday May 2016

Posted by Nicolas Sawaya in American Politics

≈ Leave a comment

Tags

Clinton, Democratic Primaries, Sanders

clinton-vs-sanders

Clinton vs. Sanders (Nigel Paray for CNN)

Actual Results:

Since our last update, Sanders gained some ground against Clinton as a result of wins in Indiana, West Virginia and Oregon (he lost Guam and Kentucky). The pledged delegate count is now 1771 vs 1499 in favor of Clinton. As such, he now trails Clinton by 272 pledged delegates. Clinton now holds a 54.2% to 45.8% advantage vs. Sanders in total pledged delegate %. Furthermore, Sanders now needs 67.5% of the remaining 781 pledged delegates to win (vs. 32.7% for Clinton). This means that if Sanders wins 67.5% of the remaining pledged delegates, he would win the battle for pledged delegates. Put differently, Sanders would need to win, on average, every contest until the end of the primaries by 34.8% to win the pledged delegate race (of course, if he wins some primaries by less than that, or straight-up loses future primaries, he would need to win other primaries by more than 34.8%). In our “Analysis Going Forward” section (see below), we present some scenarios under which Sanders could still win the pledged delegate nomination; however, keep in mind that all these scenarios are highly unlikely.

Clinton vs Sanders Graph1 5-17-16

Fig 1. The graph shows (off the left-hand axis) the number of pledged delegates won by Clinton and Sanders by state and cumulatively (Clinton in blue and Sanders in red); the remaining pledged delegates in the race (in gray); and the % of those remaining delegates needed to win for each candidate (off the right-hand axis).

A few notes worth mentioning:

  1. We’ve reached the 80%+ mark in the race. There are only 781 pledged delegates (out of 4051) in the remaining races.
  2. Sanders added an additional delegate in Maine once final numbers came in, as well as an additional delegate in Mississippi. On the other hand, he lost the 2 additional delegates he had won at the NV county convention in early April (relative to the district caucuses back in February) once the final state convention was held this past weekend. Although the state convention was marred with controversy, the end result is that the final NV delegate count reflects the original delegate count per by the district caucuses (20-15 in favor of Clinton).

Analysis of Actuals vs. Projections:

The model did OK in its projections of the primaries between April 26th and May 17th. Cumulatively, Clinton won 108 delegates vs. Sanders’ 127 delegates. The model predicted 117 for Clinton vs. 118 for Sanders. As previously discussed in our last update, we expected Sanders to win West Virginia and Oregon (which he did), and for him to be competitive in Indiana and Kentucky (he won the former by 5%, and lost the latter by less than 1%). Guam was a crap-shoot given lack of demographic data (Clinton won by a 60-40% margin). Overall, the model had projected a lead of 458 pledged delegates for Clinton at this point, for a 57.0% vs. 43.0% Clinton lead, so the model is still over-projecting in favor of Clinton (by +2.8%). That overshoot can be largely attributed to Sanders exceeding expectations during his caucus run in March. Final model projections are +590 pledged delegates and a 57.3% vs. 42.7% win for Clinton. Projections were developed after Super Tuesday on March 1st and have not changed since then. See here.

Clinton vs Sanders Graph2 5-17-16

Fig 2. The graph shows (off the left-hand axis) the delegates won or lost by Clinton after each primary (blue bars mean Clinton won the state; red means Sanders won); the size of the bars reflect the difference in delegates won or lost for each state. The bars are staggered in “water-fall” fashion to reflect Clinton’s actual total delegate lead, which is compared against model projections of Clinton’s delegate lead (black dots). The graph also tracks (off the right-hand axis) actual delegate % won for Clinton (blue line) vs. Sanders (red line), and compares against model projected % for Clinton (blue dots) vs. Sanders (red dots)

Clinton vs Sanders Table 5-17-16

Table 1. The table tracks actual pledged delegates won by Clinton and Sanders vs. model projected delegates, and calculates the delta between the two

Analysis Going Forward:

Going forward, the largest remaining chunk of delegates up for grabs occurs on June 7th, but before that, the Virgin Islands and Puerto Rico will hold their caucus and primary, respectively. Given the paucity of good demographic data for both the VI and PR, it’s hard to make any reasonable prediction, although the expectation is that Clinton will at least win PR (she won in a landslide against Obama in 2008). Aside from California, which we will discuss later, Sanders is expected to win Montana, North Dakota and South Dakota, and possibly big, given the favorable demographics and format (Montana is an open primary, North Dakota is an open caucus, and South Dakota is a semi-closed primary). On the other hand, Sanders is expected to lose New Jersey, New Mexico and the District of Columbia, all states whose demographics favor Clinton. This leaves California, which has 475 of the remaining 781 delegates, and which I believe will be a relatively close contest that Sanders is likely to lose, although not by the large margin projected by the model (the semi-closed format still allows independents to vote in the primary if they register by the appropriate date). Of course, given how far behind Sanders is in the delegate count, he not only must win California, but he needs to win it big. There are different scenarios that can still lead to a Sanders victory, but all are highly improbable:

  1. If the demographic projections per the model are accurate, Clinton is expected to win 173 vs. Sanders’ 133 delegates in remaining races ex-California, for a 56.5% vs. 43.5% margin. That would mean that Sanders would need to win California 82.9% to 17.1% (which would give him 394 delegates to Clinton ‘s 81 delegates) in order to win the pledged delegate race.
  2. If Sanders exceeds his demographic expectations and splits the remaining delegates ex-California 50%-50% with Clinton, he would need to win California by a margin of 78.7% to 21.3%.
  3. If Sanders far exceeds his demographic expectations and wins the remaining ex-California delegates by a margin of 67.5% to 32.5%, he would still need to win California by that same margin of 67.5% to 32.5%.

Of course, the alternative to winning the pledged delegate vote is to flip super-delegates at the convention, as Clinton is unlikely to get to the 2383 pledged delegates she needs to outright win the nomination, but that’s an even more unlikely scenario given that Clinton would have won the majority of the pledged delegates, the majority of the popular vote, and she is the party establishment (I also don’t believe the argument that Sanders does better than Clinton against Trump per the latest polls will sway the super-delegates, nor should it; polling 6 months out of an election has very little predictive power). Therefore, I continue to maintain that realistically, unless Clinton gets indicted between now and the convention, the best Sanders can hope for is to influence the Clinton agenda at the convention (a worthy endeavor) by staying in the race and trying to get as many delegates as he can. Next update after the primaries on June 7th.

How the model “works”:

The model regressed delegates won by Clinton vs. Sanders for primaries on March 1st and before against the “racial makeup” of those states. The resulting regression coefficients are then used to project future primaries based on the “racial makeup” of those future states.

Clinton vs. Sanders Primaries: Update 4-26

27 Wednesday Apr 2016

Posted by Nicolas Sawaya in American Politics

≈ Leave a comment

Tags

Clinton, Democratic Primaries, Sanders

clinton-vs-sanders

Clinton vs. Sanders (Nigel Paray for CNN)

Actual Results:

Sanders continues to lose ground to Clinton as a result of some big losses in PA and MD. He now trails Clinton by 291 pledged delegates. Clinton now holds a 54.8% to 45.2% advantage vs. Sanders in total pledged delegate %. Furthermore, Sanders now needs 64.4% of remaining pledged delegates to win (vs. 35.7% for Clinton). This means that if Sanders wins 64.4% of the remaining pledged delegates, he would win the battle for pledged delegates (and by extension, the popular vote). Put differently, Sanders would need to win, on average, every contest until the end of the primaries by 28.7% to win the pledged delegate race (of course, if he wins some primaries by less than that, or straight-up loses future primaries, he would need to win other primaries by more than 28.7%).

Clinton vs Sanders Graph1 4-26-16

Fig 1. The graph shows (off the left-hand axis) the number of pledged delegates won by Clinton and Sanders by state and cumulatively (Clinton in blue and Sanders in red); the remaining pledged delegates in the race (in gray); and the % of those remaining delegates needed to win for each candidate (off the right-hand axis).

A few notes worth mentioning:

  1. We’ve reached the 3/4 way mark in the race. There are 1016 pledged delegates remaining (out of 4051) in the remaining races.
  2. Sanders won an additional 3 delegates at the CO state convention. If we add the 2 delegates he won at the NV state convention and the 1 delegate change in the GA primary, that’s 6 additional delegates that Sanders has won (and Clinton has lost) in primaries pre-March 1. Given that these were technically additional races independent of the district races, I’ve created a new “pre-March 1” bucket where I’ve lumped those changes together (and penalized my predictions as a result of that).
  3. Clinton gained 1 delegate in the IL race once final numbers came in.

Analysis of Actuals vs. Projections:

The model continued to do well in its projections of the April 26th primaries. Cumulatively, Clinton won 218 delegates vs. Sanders’ 166 delegates. The model predicted 212 for Clinton vs. 172 for Sanders. As previously discussed, we expected Clinton to slightly exceed her demographic projections because of the closed nature of the primaries, which is what occurred (with the exception of Rhode Island, which was a semi-closed primary; as such, registered independents could vote, and Sanders slightly exceeded his demographic projections). Still, overall, the model had projected a lead of 459 pledged delegates for Clinton at this point, for a 57.6% vs. 42.4% Clinton lead, so the model is still over-projecting in favor of Clinton (by +2.8%). That overshoot can be largely attributed to Sanders exceeding expectations during his caucus run over the past month. Final model projections are +590 pledged delegates and a 57.3% vs. 42.7% win for Clinton. Note that we have undone the retroactive changes in delegates before March 1st (GA and NV) from the last update (in addition to adding CO), thus penalizing our projections (relative to last update) to reflect, fairly I think,  changes that occurred as a result of “new” races in pre-March 1 primaries. As such, we go back to the original projected delegate delta of 590 in favor of Clinton. Projections were developed after Super Tuesday on March 1st. See here.

Clinton vs Sanders Graph2 4-26-16

Fig 2. The graph shows (off the left-hand axis) the delegates won or lost by Clinton after each primary (blue bars mean Clinton won the state; red means Sanders won); the size of the bars reflect the difference in delegates won or lost for each state. The bars are staggered in “water-fall” fashion to reflect Clinton’s actual total delegate lead, which is compared against model projections of Clinton’s delegate lead (black dots). The graph also tracks (off the right-hand axis) actual delegate % won for Clinton (blue line) vs. Sanders (red line), and compares against model projected % for Clinton (blue dots) vs. Sanders (red dots)

Clinton vs Sanders Table 4-26-16

Table 1. The table tracks actual pledged delegates won by Clinton and Sanders vs. model projected delegates, and calculates the delta between the two

Analysis Going Forward:

The expectation going forward (in primaries/caucuses pre-June 7th) is for Sanders to win West Virginia and Oregon, and to be competitive in Indiana (open primary) and Kentucky. Guam, the Virgin Islands and Puerto Rico are all caucuses for which we have poor demographic data, so it’s a bit of a crap-shoot, although I would expect Clinton to at least win PR. Of course, Sanders is so far behind at this point that only a California miracle on June 7th can save his campaign. Indeed, assuming he splits all remaining delegates 50-50 with Clinton with the exception of California (and that’s being generous given the Clinton-favorable NJ with its 126 delegates, the largest remaining non-California state), he would need to win California 85%+ vs. 15% to win the pledged delegate vote (assuming proportional allocation, he would actually need a 90-10 win, but given allocation rules, he would get all delegates if he crosses the 85% mark; this implies that, depending on how much better than 50-50 he does, he may still need 85%+ in CA to win the pledged delegate race). The alternative to winning the pledged delegate vote is to flip super-delegates at the convention (I don’t expect Clinton to get to the 2383 pledged delegates she needs to outright win the nomination), but that’s an even more unlikely scenario. Realistically, unless Clinton gets indicted between now and the convention, the best Sanders can hope for is to influence the Clinton agenda at the convention (a worthy endeavor) by staying in the race and trying to get as many delegates as he can. Next update after the Oregon primary on May 17th.

How the model “works”:

The model regressed delegates won by Clinton vs. Sanders for primaries on March 1st and before against the “racial makeup” of those states. The resulting regression coefficients are then used to project future primaries based on the “racial makeup” of those future states.

Clinton vs. Sanders Primaries: Update 4-19

20 Wednesday Apr 2016

Posted by Nicolas Sawaya in American Politics

≈ Leave a comment

Tags

Clinton, Democratic Primaries, Sanders

clinton-vs-sanders

Clinton vs. Sanders (Nigel Paray for CNN)

Actual Results:

As a result of his big New York loss, Sanders has taken a hit since my last update. He now trails Clinton by 243 pledged delegates. Clinton now holds a 54.6% to 45.4% advantage vs. Sanders in total pledged delegate %. Furthermore, Sanders now needs 58.7% of remaining pledged delegates to win (vs. 41.4% for Clinton). This means that if Sanders wins 58.7% of the remaining pledged delegates, he would win the battle for pledged delegates (and by extension, the popular vote).

Clinton vs Sanders Graph1 4-19-16 v2

Fig 1. The graph shows (off the left-hand axis) the number of pledged delegates won by Clinton and Sanders by state and cumulatively (Clinton in blue and Sanders in red); the remaining pledged delegates in the race (in gray); and the % of those remaining delegates needed to win for each candidate (off the right-hand axis).

A few notes worth mentioning:

  1. There were some small changes in pledged delegates won in previous primaries that were retroactively adjusted as a result of final voting numbers coming in. Clinton lost 1 pledged delegate in Georgia, 2 in Arizona, but gained 1 in Hawaii, for a net loss of 2 delegates relative to our last update.
  2. Sanders won the Nevada County Convention on April 2. The 12 pledged delegates that were up for contention were won 7 vs. 5 for Sanders despite the fact that Clinton had presumably won those delegates 7 vs.5 during the Precinct caucuses. Apparently, Clinton’s delegates didn’t show up. The remaining 23 delegates were not in contention. As a result of that, Sanders gained 2 delegates (and Clinton lost 2). To be clear, nothing is officially “won” until the Nevada Democratic Convention on May 14-15. Until then, it’s important to remember that all pledged delegate calculations are estimates only.
  3. Although Sanders won the popular vote in Wyoming 56% to 44%, both he and Clinton ended up with 7 pledged delegates apiece. This is due to rounding. Recall that delegates are allocated proportionally on a district by district level according to their popular vote in those districts (in addition to the PLEOs and delegates at large for the state). Sometimes, a candidate can be unlucky, in the sense that rounding on a district by district level doesn’t end up reflecting overall popular vote numbers (keep in mind that this has happened to Clinton before as well).

Analysis of Actuals vs. Projections:

The model did really well in its projections of Wisconsin, Wyoming and New York. Cumulatively, Clinton won 184 delegates vs. Sanders’ 163 delegates. The model predicted exactly those cumulative numbers for a delta of 0. Still, overall, the model had projected a lead of 413 pledged delegates for Clinton at this point, for a 57.8% vs. 42.2% Clinton lead, so the model is still clearly over-projecting in favor of Clinton (by +3.2%). That overshoot can be largely attributed to Sanders exceeding expectations during his caucus run over the past month. Final model projections are +584 pledged delegates and a 57.2% vs. 42.8% win for Clinton. As a result of the retroactive changes in delegates before March 1st (Georgia and Nevada), the projected delegate delta went down from 590 to 584. Projections were developed right after Super Tuesday on March 1st. See here.

Clinton vs Sanders Graph2 v2 4-19-16

Fig 2. The graph shows (off the left-hand axis) the delegates won or lost by Clinton after each primary (blue bars mean Clinton won the state; red means Sanders won); the size of the bars reflect the difference in delegates won or lost for each state. The bars are staggered in “water-fall” fashion to reflect Clinton’s actual total delegate lead, which is compared against model projections of Clinton’s delegate lead (black dots). The graph also tracks (off the right-hand axis) actual delegate % won for Clinton (blue line) vs. Sanders (red line), and compares against model projected % for Clinton (blue dots) vs. Sanders (red dots)

Clinton vs Sanders Table v2 4-19-16

Table 1. The table tracks actual pledged delegates won by Clinton and Sanders vs. model projected delegates, and calculates the delta between the two

Analysis Going Forward:

The expectation is for Sanders to continue losing ground in the next 5 states that vote on the 26th of April. I expect Connecticut and Rhode Island to be close, and Maryland and Delaware to be big victories for Clinton. Pennsylvania is an interesting one, in the sense that I expect it to be closer than what most polls are predicting, but I still expect Clinton to win it. All 5 states are primaries, and with the exception of Rhode Island, all of them are closed primaries (Rhode Island is semi-closed). As such, I expect Clinton to slightly outperform her demographic projections. Next update after the 26th of April round of primaries.

How the model “works”:

The model regressed delegates won by Clinton vs. Sanders for primaries on March 1st and before against the “racial makeup” of those states. The resulting regression coefficients are then used to project future primaries based on the “racial makeup” of those future states.

Bernie Sanders’ Record on Palestine

08 Friday Apr 2016

Posted by Nicolas Sawaya in American Politics, Palestine

≈ Leave a comment

Tags

Palestine, Sanders

bernie-sanders

My article  “Bernie Sanders’ Record on Palestine” has been published at Mondoweiss.

“Bernie Sanders is clearly more progressive on the Palestinian issue than any other major candidate for the Presidency including Hillary Clinton. Still, Nicolas Sawaya says a review of his record on key issues in support of the Palestinian struggle for freedom and justice falls well short”. – Mondoweiss

Clinton vs. Sanders Primaries: Update 3-27

27 Sunday Mar 2016

Posted by Nicolas Sawaya in American Politics

≈ Leave a comment

Tags

Clinton, Democratic Primaries, Sanders

clinton-vs-sanders

Clinton vs. Sanders (Nigel Paray for CNN)

Actual Results:

Sanders did very well since my last update. He has cut into Clinton’s pledged delegate lead by almost 100 delegates, whittling her advantage from 326 to 230. Clinton now holds a 55.0% to 45.0% advantage vs. Sanders in total pledged delegate %. Furthermore, Sanders has reduced his % of pledged delegates remaining needed to win the pledged delegate vote, from 58.0% on our last update to 56.6% today. This means that if Sanders wins 56.6% of the remaining pledged delegates, he would win the battle for pledged delegates (and by extension, the popular vote).

Clinton vs Sanders Graph2 3-27-16

Fig 1. The graph shows (off the left-hand axis) the number of pledged delegates won by Clinton and Sanders by state and cumulatively (Clinton in blue and Sanders in red); the remaining pledged delegates in the race (in gray); and the % of those remaining delegates needed to win for each candidate (off the right-hand axis).

Analysis of Actuals vs. Projections:

The model projected a lead of 397 pledged delegates for Clinton at this point, for a 58.6% vs. 41.4% Clinton lead, so the model is clearly over-projecting in favor of Clinton (by +3.6%). Final model projections are +590 pledged delegates and a 57.3% vs. 42.7% win for Clinton. Projections were developed right after Super Tuesday on March 1st and will not be changed. See here.

Clinton vs Sanders Graph1 3-27-16

Fig 2. The graph shows (off the left-hand axis) the delegates won or lost by Clinton after each primary (blue bars mean Clinton won the state; red means Sanders won); the size of the bars reflect the difference in delegates won or lost for each state. The bars are staggered in “water-fall” fashion to reflect Clinton’s actual total delegate lead, which is compared against model projections of Clinton’s delegate lead (black dots). The graph also tracks (off the right-hand axis) actual delegate % won for Clinton (blue line) vs. Sanders (red line), and compares against model projected % for Clinton (blue dots) vs. Sanders (red dots)

Clinton vs Sanders Table 3-27-16

Table 1. The table tracks actual pledged delegates won by Clinton and Sanders vs. model projected delegates, and calculates the delta between the two

The model projections under-performed relative to Sanders’ actual win totals. This can be explained because of 2 reasons:

1) Given that the model works based on a regression of “racial demographics”, it’s important to have good demographic data. The misses on Democrats Abroad, Alaska and Hawaii can be attributed to no demographic and poor demographic data, respectively (we had no demographic data for Democrats Abroad, and Alaska and Hawaii don’t fit our simple White/Black/Hispanic bucketing very well). As such, these misses are not big surprises.

2) A more interesting phenomena is Sanders’ performance in caucus states. Although the model predicted that Sanders would win Idaho, Utah and Washington (and Kansas previously), clearly, he does much better than expected based on projections using simple demographics. I would argue that this is because the caucus format rewards Sanders’ base much more so than Clinton’s.

The so-called “enthusiasm gap” manifests itself in these formats, where people are expected to caucus for significant chunks of the day, and Sanders certainly has very dedicated supporters. As such, when the caucus format is over-layed on top of demographics, this exacerbates the difference in victory in favor of Sanders. This can be contrasted to the primary format, which is less “demanding” of voters and where Clinton does much better than Sanders, and where demographic projections seem right in line with results.

One could also add an additional variable around whether the primary/caucus is open or closed (closed implies only registered Democrats can vote, whereas open implies anyone can register and vote; there are formats in-between as well), where Clinton seems to do better than expected in the closed format given her large lead with registered Democrats.

As such, in retrospect, adding secondary variables around “primaries vs. caucus format” and perhaps “open vs. closed” in the model to complement the primary predictive demographic variables would have likely enhanced results.

Analysis Going Forward:

The bad news for Sanders is that are only 4 remaining caucus states left (Wyoming, Guam, Puerto Rico, Virgin Islands), and they are all relatively small and closed caucuses. Going forward, Wyoming is a closed caucus, Wisconsin is an open primary, and the next states through April 26 are all closed primaries (Rhode Island is semi-closed), including the big states of New York and Pennsylvania. As such, I expect Clinton to slightly outperform her demographic projections. Despite Sanders’ strong performance over the past couple of weeks, I still strongly believe that Clinton will beat Sanders, and I suspect when it’s all said and done, she will do so within ~3% of initial model projections. More to come. Next update after New York.

How the model “works”:

The model regressed delegates won by Clinton vs. Sanders for primaries on March 1st and before against the “racial makeup” of those states. The resulting regression coefficients are then used to project future primaries based on the “racial makeup” of those future states.

Clinton vs. Sanders Primaries: Update 3-18

18 Friday Mar 2016

Posted by Nicolas Sawaya in American Politics

≈ Leave a comment

Tags

Clinton, Democratic Primaries, Sanders

clinton-vs-sanders

Clinton vs. Sanders (Nigel Paray for CNN)

Projections were developed right after Super Tuesday on March 1st and will not be changed. See here.

Right after Super Tuesday, Clinton led Sanders by 199 pledged delegates and had won 59.7% of the pledged delegates (vs. 40.3% for Sanders). Since then, Clinton has widened her lead to 326 pledged delegates and leads Sanders 58.1% vs. 41.9% in total pledged delegate %. The model projected a lead of 389 pledged delegates for Clinton at this point, for a 59.6% vs. 40.4% Clinton lead, so the model is slightly over-projecting in favor of Clinton (by +1.5%). Final model projections are +590 pledged delegates and a 57.3% vs. 42.7% win for Clinton. See table and graph below:

Clinton vs Sanders Graph 3-18-16

Fig 1. The graph shows (off the left-hand axis) the delegates won or lost by Clinton after each primary (blue bars mean Clinton won the state; red means Sanders won); the size of the bars reflect the difference in delegates won or lost for each state. The bars are staggered in “water-fall” fashion to reflect Clinton’s actual total delegate lead, which is compared against model projections of Clinton’s delegate lead (black dots). The graph also tracks (off the right-hand axis) actual delegate % won for Clinton (blue line) vs. Sanders (red line), and compares against model projected % for Clinton (blue dots) vs. Sanders (red dots)

Clinton vs Sanders Table 3-18-16

Table 1. The table tracks actual pledged delegates won by Clinton and Sanders vs. model projected delegates, and calculates the delta between the two

How the model “works”:

The model regressed delegates won by Clinton vs. Sanders for primaries on March 1st and before against the “racial makeup” of those states. The resulting regression coefficients are then used to project future primaries based on the “racial makeup” of those future states.

Clinton vs. Sanders Primaries: Update 3-14

14 Monday Mar 2016

Posted by Nicolas Sawaya in American Politics

≈ Leave a comment

Tags

Clinton, Democratic Primaries, Sanders

clinton-vs-sanders

Clinton vs. Sanders (Nigel Paray for CNN)

For fun, I plan on updating the Clinton vs. Sanders nomination battle after each major set of primaries and tracking actual pledged delegate counts vs. projected delegate counts based on the model I developed right after Super Tuesday (March 1st). See previous post here.

Projections were developed right after March 1st and will not be changed but I will update the actual count to compare against model projections.

Right after Super Tuesday, Clinton led Sanders by 199 delegates and had won 59.7% of the pledged delegates (vs. 40.3% for Sanders). Since then, Clinton has widened her lead to 223 pledged delegates and leads Sanders 58.4% vs. 41.6% in total pledged delegate %. The model projected a lead of 249 delegates for Clinton at this point, for a 59.4% vs. 40.6% Clinton lead, so the model is slightly over-projecting in favor of Clinton. Final model projections are +590 delegates and a 57.3% vs. 42.7% win for Clinton. See table and graph below:

Clinton vs Sanders Graph 3-14-16

Fig 1. The graph shows (off the left-hand axis) the delegates won or lost by Clinton after each primary (blue bars mean Clinton won the state; red means Sanders won); the size of the bars reflect the difference in delegates won or lost for each state. The bars are staggered in “water-fall” fashion to reflect Clinton’s actual total delegate lead, which is compared against model projections of Clinton’s delegate lead (black dots). The graph also tracks (off the right-hand axis) actual delegate % won for Clinton (blue line) vs. Sanders (red line), and compares against model projected % for Clinton (blue dots) vs. Sanders (red dots)

Clinton vs Sanders Table 3-14-16

Table 1. The table tracks actual pledged delegates won by Clinton and Sanders vs. model projected delegates, and calculates the delta between the two

How the model “works”:

The model regressed delegates won by Clinton vs. Sanders for primaries on March 1st and before against the “racial makeup” of those states. The resulting regression coefficients were then used to project future primaries based on the “racial makeup” of those future states.

Why Bernie Sanders won’t win: Demographics

04 Friday Mar 2016

Posted by Nicolas Sawaya in American Politics

≈ Leave a comment

Tags

Clinton, Democratic Primaries, Sanders

clinton-vs-sanders

Clinton vs. Sanders (Nigel Paray for CNN)

Much has been made about Bernie Sanders’ poor performance with minorities so far in the democratic primaries (see here and here). Indeed, an analysis by ABC news of exit polls of all democratic primaries so far reveals that only 15% of black voters and 36% of Hispanics have voted for Sanders (vs. 83% and 63%, respectively, for Clinton); by contrast, Sanders has picked up 48% of the white vote (vs. 50% for Clinton).

ABC Analysis of Democratic Exit Polls

Sanders supporters acknowledge this fact, but counter this by pointing to a more favorable landscape going forward in remaining states, especially post March 22nd. Although this point is true (as we’ll see below), the question remains: is it favorable enough for Sanders to win the nomination. As such, we’re interested in answering the following questions:

  • Does the “racial makeup” of a state (i.e. White / Black / Hispanic demographic split) have any value in predicting the pledged delegate vote?
  • If it does, what do Sanders and Clinton’s delegate projections look like for the remaining races?
  • What would it take for Sanders to win the pledged delegates race?

In order to answer the first question, we regress pledged delegates won by Clinton vs. Sanders for primaries on March 1st and before against the “racial makeup” of those states and check the quality of the fit. The purpose of the regression is to find a set of optimal coefficients that, when multiplied by the “racial demographics” of each state and then by the number of delegates available for that state, result in a set of calculated pledged delegates that match as closely as possible the actual delegates won by each candidate for states that have already voted. The results of the regression are listed in Table 1:

Table 1 Clinton vs Sanders

Table 1. Actual pledged delegates won by Clinton vs. Sanders compared against calculated pledged delegates from regression model

The quality of the fit can intuitively be appreciated by comparing the results of the regression (columns labeled “Projected Delegates”) vs. number of delegates actually won (columns labeled “Delegates Won”) on a state by state level. The closer the regression results are to the actuals (i.e. the closer the “Projected Delegates Delta” columns are to 0), the better the fit. Even though the regression is not perfect (in the sense that the delta between our regression results and the actuals is not 0 for each state), the deviations are relatively minor. Mathematically, this intuition can be assessed more formally by checking the R2 coefficient of the regression (there are other ways as well). The closer this coefficient is to 1, the better the regression is. Given that our R2 coefficient is 0.99 for Clinton and 0.965 for Sanders (the adjusted R2 for Clinton is 0.986 and 0.952 for Sanders), we can conclude that this a good regression (see here and here for a good introduction to regression). This implies that there is a strong correlation between candidate preference and the “racial make-up” of a state, at least based on the states that voted on March 1st and before. Although this strong correlation doesn’t necessarily imply anything causal on its own (in the sense that this could be a spurious correlation), there seems to be a lot of independent evidence that this is indeed a meaningful correlation.

And what of the regression coefficients that yielded the above results? It will come as no surprise that the coefficients reflect what we expected, which is to say that minorities play a very important part of Clinton’s success, while the White vote explains most of Sanders’ success.  For completeness, we list the coefficients here:

Regression coefficients Clinton vs Sanders

In order to answer the second question, we multiply the regression coefficients by the “racial makeup” of future states and then by the pledged delegates available for those future states to project future primaries. Our total projected delegates for these future states is presented in table 2:

Table 2 Clinton vs Sanders

Table 2. Projected pledged delegates from regression model

If we look at the projections based on our regression method, we see that Sanders performs better than Clinton in states with a large fraction of White voters, while Clinton does better in more diverse states. Overall, we expect that Clinton will win 2321 delegates (57.3% of total pledged delegates) vs. Sanders’ 1730 delegates (42.7%). As such, we can see that Sanders loses the pledged delegates vote handily.

The third and final question can now be asked: what would it take for Sanders to win? We choose to answer this question by asking a proxy question: what would the candidate preference by White / Black / Hispanic voters have to be going forward for Sanders to win the nomination?

There are multiple ways to do this, and we run three different scenarios. For all scenarios, we assume that the future popular vote won is proportional to the number of pledged delegates won; this is a reasonable assumption, on average, as the Democratic primaries proportionally allocate their delegates once a 15% threshold of the vote is met:

  • Assuming minorities continue voting as they have in states that have already voted, Sanders would have to win about 70% of the White vote going forward. Given that Sanders has only managed to win 48% of the White vote so far, expecting him to win an additional 20%+ going forward seems implausible.
  • Assuming Sanders continues to capture the same amount of the White vote as he has, he would need to capture 70% of the Black and Hispanic vote to win the nomination. This seems even more implausible given his current percentages with minorities.
  • Assuming Sanders captures 60% of the White vote (a +12% increase vs. today), he would need to capture 50% of the Black and Hispanic vote (a +36% and +14% increase vs. today, respectively) to win the nomination. As such, even with such a drastic increase in the White vote captured, Sanders would somehow have to triple his percentage with Black voters, and significantly increase his support with Hispanics. Again, this simply does not seem realistic.

Note that throughout this analysis, we have ignored super-delegates (who favor Clinton). One of the interesting conclusions resulting from this exercise is that talk of super-delegates in this race is superfluous: unless Clinton gets forced out of the race (because she gets indicted, imprisoned, or some other far-fetched scenario) Sanders is extremely unlikely to win the popular vote, because of demographics.

Some notes:

“Racial makeup” in red in Tables 1 and 2 come from 2016 democratic primary exit polls; in black from 2008 democratic primary exit polls (note that this helps Sanders as minorities, which Clinton wins handily, have increased their percentages over the past 8 years); in blue for Florida from the latest 2016 democratic primary poll available; in green from the “racial make-up” of the state as a whole (no better data was available) based on, for the most part, the 2010 census; in gray for Democrats Abroad based on an assumption that neither candidate is favored given lack of information.

← Older posts

Recent Posts

  • On equation (4) in “A Computationally Useful Algebraic Representation of Nonlinear Disjunctive Convex Sets Using the Perspective Function”
  • Beirut
  • Michael Moore’s “Planet of the Humans”
  • A Computationally Useful Algebraic Representation of Nonlinear Disjunctive Convex Sets Using the Perspective Function
  • Lebanon Uprising: Some More (Tentative) Thoughts on the Currency Crisis

Recent Comments

theblackotterblog on Zionism’s collaboration…
nicolassawaya on Zionism’s collaboration…
Hadeel on Zionism’s collaboration…

Archives

  • September 2020
  • August 2020
  • May 2020
  • March 2020
  • November 2019
  • October 2019
  • June 2019
  • May 2019
  • April 2019
  • October 2018
  • May 2017
  • February 2017
  • January 2017
  • December 2016
  • July 2016
  • May 2016
  • April 2016
  • March 2016
  • February 2016
  • October 2015
  • January 2015
  • December 2014
  • September 2014
  • August 2014
  • July 2014
  • August 2013
  • July 2013

Categories

  • American Current Events
  • American Politics
  • Arts
  • Energy
  • Islam
  • Law
  • Lebanon
  • Math
  • Palestine
  • Philosophy
  • Poetry
  • Sports
  • Syria
  • Terrorism
  • Zionism

Blog at WordPress.com.

  • Follow Following
    • Notes From Underground
    • Already have a WordPress.com account? Log in now.
    • Notes From Underground
    • Customize
    • Follow Following
    • Sign up
    • Log in
    • Report this content
    • View site in Reader
    • Manage subscriptions
    • Collapse this bar
 

Loading Comments...