

Clinton vs. Sanders (Nigel Paray for CNN)
Actual Results:
Since our last update, Sanders gained some ground against Clinton as a result of wins in Indiana, West Virginia and Oregon (he lost Guam and Kentucky). The pledged delegate count is now 1771 vs 1499 in favor of Clinton. As such, he now trails Clinton by 272 pledged delegates. Clinton now holds a 54.2% to 45.8% advantage vs. Sanders in total pledged delegate %. Furthermore, Sanders now needs 67.5% of the remaining 781 pledged delegates to win (vs. 32.7% for Clinton). This means that if Sanders wins 67.5% of the remaining pledged delegates, he would win the battle for pledged delegates. Put differently, Sanders would need to win, on average, every contest until the end of the primaries by 34.8% to win the pledged delegate race (of course, if he wins some primaries by less than that, or straight-up loses future primaries, he would need to win other primaries by more than 34.8%). In our “Analysis Going Forward” section (see below), we present some scenarios under which Sanders could still win the pledged delegate nomination; however, keep in mind that all these scenarios are highly unlikely.
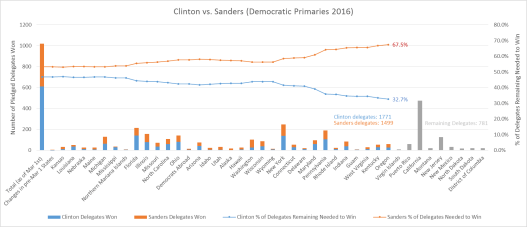
Fig 1. The graph shows (off the left-hand axis) the number of pledged delegates won by Clinton and Sanders by state and cumulatively (Clinton in blue and Sanders in red); the remaining pledged delegates in the race (in gray); and the % of those remaining delegates needed to win for each candidate (off the right-hand axis).
A few notes worth mentioning:
- We’ve reached the 80%+ mark in the race. There are only 781 pledged delegates (out of 4051) in the remaining races.
- Sanders added an additional delegate in Maine once final numbers came in, as well as an additional delegate in Mississippi. On the other hand, he lost the 2 additional delegates he had won at the NV county convention in early April (relative to the district caucuses back in February) once the final state convention was held this past weekend. Although the state convention was marred with controversy, the end result is that the final NV delegate count reflects the original delegate count per by the district caucuses (20-15 in favor of Clinton).
Analysis of Actuals vs. Projections:
The model did OK in its projections of the primaries between April 26th and May 17th. Cumulatively, Clinton won 108 delegates vs. Sanders’ 127 delegates. The model predicted 117 for Clinton vs. 118 for Sanders. As previously discussed in our last update, we expected Sanders to win West Virginia and Oregon (which he did), and for him to be competitive in Indiana and Kentucky (he won the former by 5%, and lost the latter by less than 1%). Guam was a crap-shoot given lack of demographic data (Clinton won by a 60-40% margin). Overall, the model had projected a lead of 458 pledged delegates for Clinton at this point, for a 57.0% vs. 43.0% Clinton lead, so the model is still over-projecting in favor of Clinton (by +2.8%). That overshoot can be largely attributed to Sanders exceeding expectations during his caucus run in March. Final model projections are +590 pledged delegates and a 57.3% vs. 42.7% win for Clinton. Projections were developed after Super Tuesday on March 1st and have not changed since then. See here.
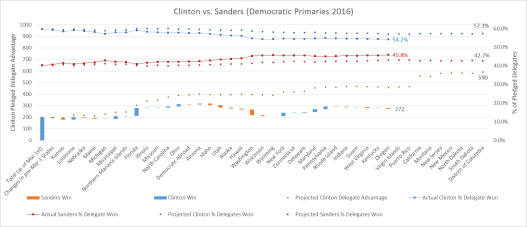
Fig 2. The graph shows (off the left-hand axis) the delegates won or lost by Clinton after each primary (blue bars mean Clinton won the state; red means Sanders won); the size of the bars reflect the difference in delegates won or lost for each state. The bars are staggered in “water-fall” fashion to reflect Clinton’s actual total delegate lead, which is compared against model projections of Clinton’s delegate lead (black dots). The graph also tracks (off the right-hand axis) actual delegate % won for Clinton (blue line) vs. Sanders (red line), and compares against model projected % for Clinton (blue dots) vs. Sanders (red dots)

Table 1. The table tracks actual pledged delegates won by Clinton and Sanders vs. model projected delegates, and calculates the delta between the two
Analysis Going Forward:
Going forward, the largest remaining chunk of delegates up for grabs occurs on June 7th, but before that, the Virgin Islands and Puerto Rico will hold their caucus and primary, respectively. Given the paucity of good demographic data for both the VI and PR, it’s hard to make any reasonable prediction, although the expectation is that Clinton will at least win PR (she won in a landslide against Obama in 2008). Aside from California, which we will discuss later, Sanders is expected to win Montana, North Dakota and South Dakota, and possibly big, given the favorable demographics and format (Montana is an open primary, North Dakota is an open caucus, and South Dakota is a semi-closed primary). On the other hand, Sanders is expected to lose New Jersey, New Mexico and the District of Columbia, all states whose demographics favor Clinton. This leaves California, which has 475 of the remaining 781 delegates, and which I believe will be a relatively close contest that Sanders is likely to lose, although not by the large margin projected by the model (the semi-closed format still allows independents to vote in the primary if they register by the appropriate date). Of course, given how far behind Sanders is in the delegate count, he not only must win California, but he needs to win it big. There are different scenarios that can still lead to a Sanders victory, but all are highly improbable:
- If the demographic projections per the model are accurate, Clinton is expected to win 173 vs. Sanders’ 133 delegates in remaining races ex-California, for a 56.5% vs. 43.5% margin. That would mean that Sanders would need to win California 82.9% to 17.1% (which would give him 394 delegates to Clinton ‘s 81 delegates) in order to win the pledged delegate race.
- If Sanders exceeds his demographic expectations and splits the remaining delegates ex-California 50%-50% with Clinton, he would need to win California by a margin of 78.7% to 21.3%.
- If Sanders far exceeds his demographic expectations and wins the remaining ex-California delegates by a margin of 67.5% to 32.5%, he would still need to win California by that same margin of 67.5% to 32.5%.
Of course, the alternative to winning the pledged delegate vote is to flip super-delegates at the convention, as Clinton is unlikely to get to the 2383 pledged delegates she needs to outright win the nomination, but that’s an even more unlikely scenario given that Clinton would have won the majority of the pledged delegates, the majority of the popular vote, and she is the party establishment (I also don’t believe the argument that Sanders does better than Clinton against Trump per the latest polls will sway the super-delegates, nor should it; polling 6 months out of an election has very little predictive power). Therefore, I continue to maintain that realistically, unless Clinton gets indicted between now and the convention, the best Sanders can hope for is to influence the Clinton agenda at the convention (a worthy endeavor) by staying in the race and trying to get as many delegates as he can. Next update after the primaries on June 7th.
How the model “works”:
The model regressed delegates won by Clinton vs. Sanders for primaries on March 1st and before against the “racial makeup” of those states. The resulting regression coefficients are then used to project future primaries based on the “racial makeup” of those future states.
