

Clinton vs. Sanders (Nigel Paray for CNN)
Actual Results:
Sanders continues to lose ground to Clinton as a result of some big losses in PA and MD. He now trails Clinton by 291 pledged delegates. Clinton now holds a 54.8% to 45.2% advantage vs. Sanders in total pledged delegate %. Furthermore, Sanders now needs 64.4% of remaining pledged delegates to win (vs. 35.7% for Clinton). This means that if Sanders wins 64.4% of the remaining pledged delegates, he would win the battle for pledged delegates (and by extension, the popular vote). Put differently, Sanders would need to win, on average, every contest until the end of the primaries by 28.7% to win the pledged delegate race (of course, if he wins some primaries by less than that, or straight-up loses future primaries, he would need to win other primaries by more than 28.7%).
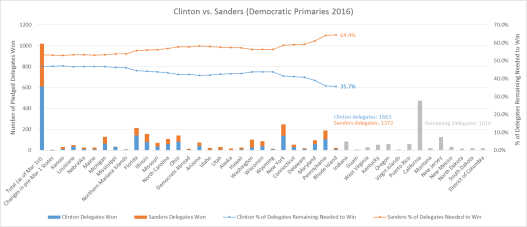
Fig 1. The graph shows (off the left-hand axis) the number of pledged delegates won by Clinton and Sanders by state and cumulatively (Clinton in blue and Sanders in red); the remaining pledged delegates in the race (in gray); and the % of those remaining delegates needed to win for each candidate (off the right-hand axis).
A few notes worth mentioning:
- We’ve reached the 3/4 way mark in the race. There are 1016 pledged delegates remaining (out of 4051) in the remaining races.
- Sanders won an additional 3 delegates at the CO state convention. If we add the 2 delegates he won at the NV state convention and the 1 delegate change in the GA primary, that’s 6 additional delegates that Sanders has won (and Clinton has lost) in primaries pre-March 1. Given that these were technically additional races independent of the district races, I’ve created a new “pre-March 1” bucket where I’ve lumped those changes together (and penalized my predictions as a result of that).
- Clinton gained 1 delegate in the IL race once final numbers came in.
Analysis of Actuals vs. Projections:
The model continued to do well in its projections of the April 26th primaries. Cumulatively, Clinton won 218 delegates vs. Sanders’ 166 delegates. The model predicted 212 for Clinton vs. 172 for Sanders. As previously discussed, we expected Clinton to slightly exceed her demographic projections because of the closed nature of the primaries, which is what occurred (with the exception of Rhode Island, which was a semi-closed primary; as such, registered independents could vote, and Sanders slightly exceeded his demographic projections). Still, overall, the model had projected a lead of 459 pledged delegates for Clinton at this point, for a 57.6% vs. 42.4% Clinton lead, so the model is still over-projecting in favor of Clinton (by +2.8%). That overshoot can be largely attributed to Sanders exceeding expectations during his caucus run over the past month. Final model projections are +590 pledged delegates and a 57.3% vs. 42.7% win for Clinton. Note that we have undone the retroactive changes in delegates before March 1st (GA and NV) from the last update (in addition to adding CO), thus penalizing our projections (relative to last update) to reflect, fairly I think, changes that occurred as a result of “new” races in pre-March 1 primaries. As such, we go back to the original projected delegate delta of 590 in favor of Clinton. Projections were developed after Super Tuesday on March 1st. See here.
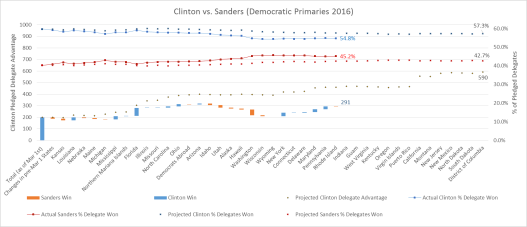
Fig 2. The graph shows (off the left-hand axis) the delegates won or lost by Clinton after each primary (blue bars mean Clinton won the state; red means Sanders won); the size of the bars reflect the difference in delegates won or lost for each state. The bars are staggered in “water-fall” fashion to reflect Clinton’s actual total delegate lead, which is compared against model projections of Clinton’s delegate lead (black dots). The graph also tracks (off the right-hand axis) actual delegate % won for Clinton (blue line) vs. Sanders (red line), and compares against model projected % for Clinton (blue dots) vs. Sanders (red dots)

Table 1. The table tracks actual pledged delegates won by Clinton and Sanders vs. model projected delegates, and calculates the delta between the two
Analysis Going Forward:
The expectation going forward (in primaries/caucuses pre-June 7th) is for Sanders to win West Virginia and Oregon, and to be competitive in Indiana (open primary) and Kentucky. Guam, the Virgin Islands and Puerto Rico are all caucuses for which we have poor demographic data, so it’s a bit of a crap-shoot, although I would expect Clinton to at least win PR. Of course, Sanders is so far behind at this point that only a California miracle on June 7th can save his campaign. Indeed, assuming he splits all remaining delegates 50-50 with Clinton with the exception of California (and that’s being generous given the Clinton-favorable NJ with its 126 delegates, the largest remaining non-California state), he would need to win California 85%+ vs. 15% to win the pledged delegate vote (assuming proportional allocation, he would actually need a 90-10 win, but given allocation rules, he would get all delegates if he crosses the 85% mark; this implies that, depending on how much better than 50-50 he does, he may still need 85%+ in CA to win the pledged delegate race). The alternative to winning the pledged delegate vote is to flip super-delegates at the convention (I don’t expect Clinton to get to the 2383 pledged delegates she needs to outright win the nomination), but that’s an even more unlikely scenario. Realistically, unless Clinton gets indicted between now and the convention, the best Sanders can hope for is to influence the Clinton agenda at the convention (a worthy endeavor) by staying in the race and trying to get as many delegates as he can. Next update after the Oregon primary on May 17th.
How the model “works”:
The model regressed delegates won by Clinton vs. Sanders for primaries on March 1st and before against the “racial makeup” of those states. The resulting regression coefficients are then used to project future primaries based on the “racial makeup” of those future states.
